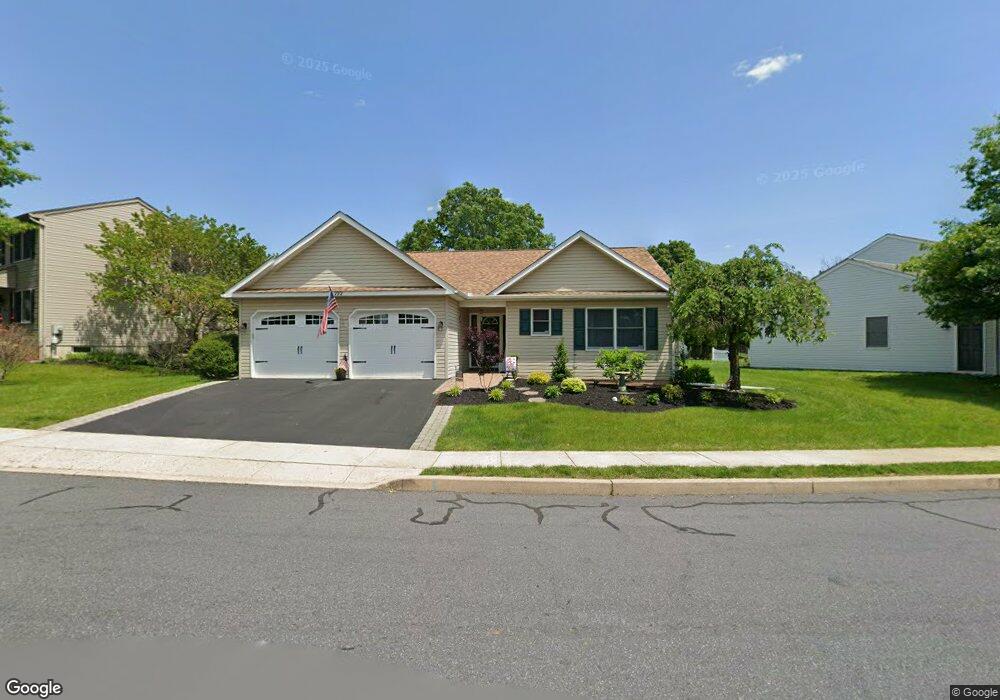
792 Hunter Dr Pennsburg, PA 18073
Estimated Value: $428,761 - $469,000
3
Beds
2
Baths
1,778
Sq Ft
$250/Sq Ft
Est. Value
About This Home
This home is located at 792 Hunter Dr, Pennsburg, PA 18073 and is currently estimated at $445,190, approximately $250 per square foot. 792 Hunter Dr is a home located in Montgomery County with nearby schools including Upper Perkiomen 4th & 5th Grade Center, Upper Perkiomen Middle School, and Upper Perkiomen High School.
Ownership History
Date
Name
Owned For
Owner Type
Purchase Details
Closed on
Oct 21, 2011
Sold by
Kypreos Brandy
Bought by
Miles Victoria M and Miles Jay A
Current Estimated Value
Home Financials for this Owner
Home Financials are based on the most recent Mortgage that was taken out on this home.
Original Mortgage
$155,000
Outstanding Balance
$105,614
Interest Rate
4.08%
Estimated Equity
$339,576
Purchase Details
Closed on
Jan 4, 2008
Sold by
Ellsworth James J
Bought by
Kypreos Brandy
Home Financials for this Owner
Home Financials are based on the most recent Mortgage that was taken out on this home.
Original Mortgage
$165,000
Interest Rate
6.02%
Purchase Details
Closed on
Jun 27, 2003
Sold by
Albitz Donald P
Bought by
Ellsworth James J and Ellsworth Mary N
Create a Home Valuation Report for This Property
The Home Valuation Report is an in-depth analysis detailing your home's value as well as a comparison with similar homes in the area
Home Values in the Area
Average Home Value in this Area
Purchase History
| Date | Buyer | Sale Price | Title Company |
|---|---|---|---|
| Miles Victoria M | $245,000 | None Available | |
| Kypreos Brandy | $305,000 | None Available | |
| Ellsworth James J | $211,847 | -- |
Source: Public Records
Mortgage History
| Date | Status | Borrower | Loan Amount |
|---|---|---|---|
| Open | Miles Victoria M | $155,000 | |
| Previous Owner | Kypreos Brandy | $165,000 |
Source: Public Records
Tax History Compared to Growth
Tax History
| Year | Tax Paid | Tax Assessment Tax Assessment Total Assessment is a certain percentage of the fair market value that is determined by local assessors to be the total taxable value of land and additions on the property. | Land | Improvement |
|---|---|---|---|---|
| 2025 | $6,102 | $149,610 | $44,640 | $104,970 |
| 2024 | $6,102 | $149,610 | $44,640 | $104,970 |
| 2023 | $5,642 | $149,610 | $44,640 | $104,970 |
| 2022 | $5,576 | $149,610 | $44,640 | $104,970 |
| 2021 | $5,457 | $149,610 | $44,640 | $104,970 |
| 2020 | $5,431 | $149,610 | $44,640 | $104,970 |
| 2019 | $5,328 | $149,610 | $44,640 | $104,970 |
| 2018 | $5,329 | $149,610 | $44,640 | $104,970 |
| 2017 | $5,006 | $149,610 | $44,640 | $104,970 |
| 2016 | $4,949 | $149,610 | $44,640 | $104,970 |
| 2015 | $4,787 | $149,610 | $44,640 | $104,970 |
| 2014 | $4,633 | $149,610 | $44,640 | $104,970 |
Source: Public Records
Map
Nearby Homes
- 765 Fawn Way
- 716 Deerfield Blvd
- 716 Deerfield Blvd Unit Lot 4
- 708 Deerfield Blvd
- 708 Deerfield Blvd Unit Lot 2
- 714 Deerfield Blvd
- 714 Deerfield Blvd Unit Lot 3
- 872 Peaceful Ln
- Daisy Plan at Deerfield - Deerfield Duplex Homes
- Ivy Plan at Deerfield - Deerfield Duplex Homes
- White Oak Plan at Deerfield
- Revere Plan at Deerfield
- Emily Plan at Deerfield
- Black Cherry Plan at Deerfield
- 906 Montgomery Ave
- 772 Main St
- 430 Seminary St
- 419 Seminary St
- 1418-1/5 W 4th St
- 1030 Walt Rd