Estimated Value: $286,000 - $319,590
4
Beds
2
Baths
1,924
Sq Ft
$161/Sq Ft
Est. Value
About This Home
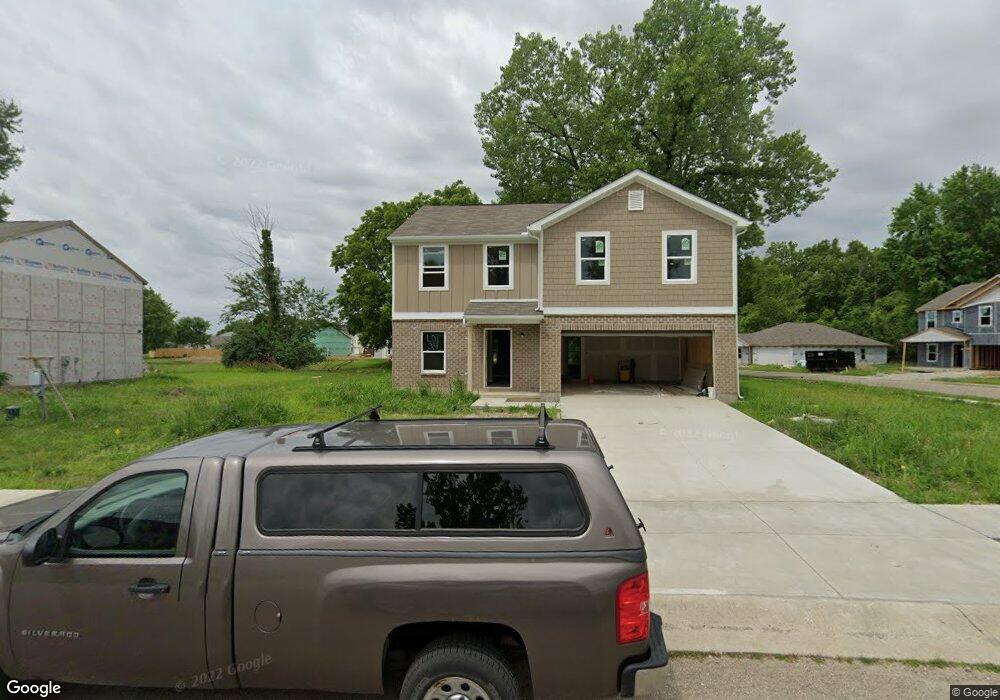
This home is located at 792 Marshal Dr, Xenia, OH 45385 and is currently estimated at $309,898, approximately $161 per square foot. 792 Marshal Dr is a home located in Greene County with nearby schools including Xenia High School and Legacy Christian Academy.
Ownership History
Date
Name
Owned For
Owner Type
Purchase Details
Closed on
Dec 13, 2024
Sold by
Morgan Rick and Morgan Ricky
Bought by
Rubio Jose and Rubio Paige Nicole
Current Estimated Value
Home Financials for this Owner
Home Financials are based on the most recent Mortgage that was taken out on this home.
Original Mortgage
$268,312
Outstanding Balance
$266,198
Interest Rate
6.78%
Mortgage Type
VA
Estimated Equity
$43,700
Purchase Details
Closed on
Jul 21, 2022
Sold by
Wjhoh Llc
Bought by
Morgan Ricky
Home Financials for this Owner
Home Financials are based on the most recent Mortgage that was taken out on this home.
Original Mortgage
$200,000
Interest Rate
5.81%
Mortgage Type
New Conventional
Purchase Details
Closed on
Feb 24, 2021
Sold by
Preserve At Meadow Brook Llc
Bought by
Wjh Llc and Wjhoh Llc
Purchase Details
Closed on
Dec 2, 2011
Sold by
Sugarhill Development
Bought by
Fifth Third Bank
Create a Home Valuation Report for This Property
The Home Valuation Report is an in-depth analysis detailing your home's value as well as a comparison with similar homes in the area
Home Values in the Area
Average Home Value in this Area
Purchase History
| Date | Buyer | Sale Price | Title Company |
|---|---|---|---|
| Rubio Jose | $295,000 | None Listed On Document | |
| Rubio Jose | $295,000 | None Listed On Document | |
| Morgan Ricky | -- | Mcnamee & Mcnamee Pll | |
| Wjh Llc | -- | None Listed On Document | |
| Fifth Third Bank | $434,000 | None Available |
Source: Public Records
Mortgage History
| Date | Status | Borrower | Loan Amount |
|---|---|---|---|
| Open | Rubio Jose | $268,312 | |
| Closed | Rubio Jose | $268,312 | |
| Previous Owner | Morgan Ricky | $200,000 |
Source: Public Records
Tax History Compared to Growth
Tax History
| Year | Tax Paid | Tax Assessment Tax Assessment Total Assessment is a certain percentage of the fair market value that is determined by local assessors to be the total taxable value of land and additions on the property. | Land | Improvement |
|---|---|---|---|---|
| 2024 | $3,264 | $78,280 | $16,730 | $61,550 |
| 2023 | $3,264 | $78,280 | $16,730 | $61,550 |
| 2022 | $517 | $10,300 | $10,300 | $0 |
| 2021 | $98 | $1,930 | $1,930 | $0 |
| 2020 | $94 | $1,930 | $1,930 | $0 |
| 2019 | $12 | $230 | $230 | $0 |
| 2018 | $12 | $230 | $230 | $0 |
| 2017 | $12 | $230 | $230 | $0 |
| 2016 | $12 | $230 | $230 | $0 |
| 2015 | $12 | $230 | $230 | $0 |
| 2014 | $12 | $230 | $230 | $0 |
Source: Public Records
Map
Nearby Homes
- 656 Eden Roc Dr
- 610 Saxony Dr
- 513 Redbud Ln
- 508 Marshall Dr
- 568 Louise Dr
- 1311 Eagles Way
- 479 N Stadium Dr
- 348 S Stadium Dr
- 1038 Frederick Dr
- 878 N Detroit St
- 902 N Detroit St
- 1171 N Detroit St
- 1112 N Detroit St
- 659 N King St
- 119 Park Dr
- 645 E Church St
- 516 N King St
- 612 E Market St
- 613 N West St
- 214 Corwin Ave