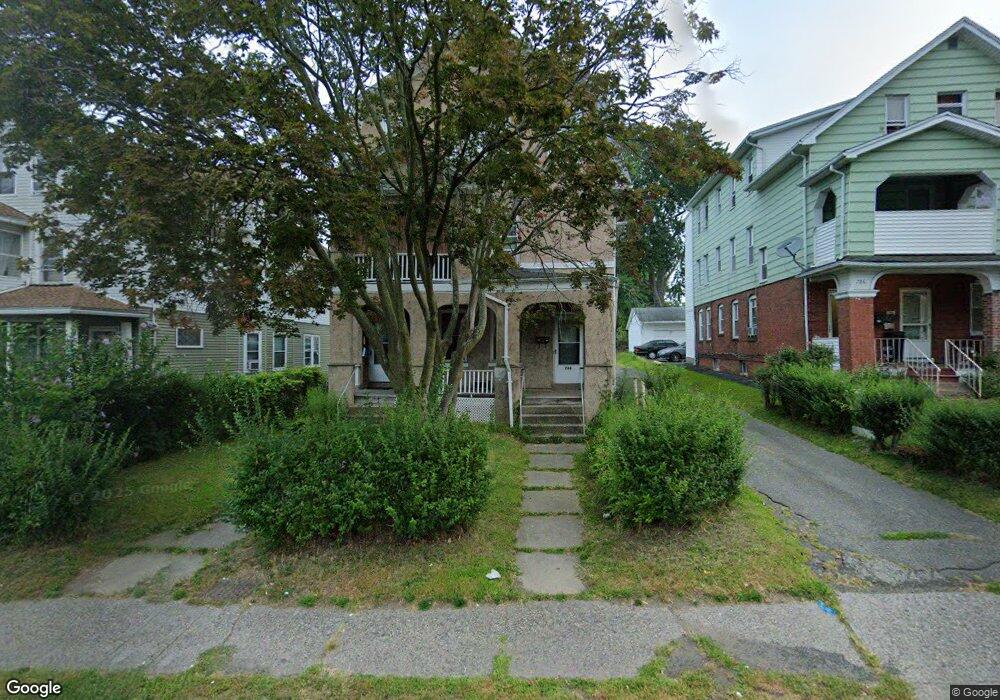
792 New Britain Ave Unit 794 Hartford, CT 06106
South West NeighborhoodEstimated Value: $239,504 - $485,000
6
Beds
3
Baths
3,413
Sq Ft
$116/Sq Ft
Est. Value
About This Home
This home is located at 792 New Britain Ave Unit 794, Hartford, CT 06106 and is currently estimated at $396,376, approximately $116 per square foot. 792 New Britain Ave Unit 794 is a home located in Hartford County with nearby schools including Kennelly School, Environmental Sciences Magnet School at Mary Hooker, and Parkville Community School.
Ownership History
Date
Name
Owned For
Owner Type
Purchase Details
Closed on
Jun 14, 2017
Sold by
Nguyen Michael
Bought by
Mn Estates Llc
Current Estimated Value
Purchase Details
Closed on
Jan 22, 2016
Sold by
Nguyen Huong T
Bought by
Nguyen Michael
Purchase Details
Closed on
May 20, 2011
Sold by
Wise Steven Craig
Bought by
Nguyen Huong T
Home Financials for this Owner
Home Financials are based on the most recent Mortgage that was taken out on this home.
Original Mortgage
$93,750
Interest Rate
4.88%
Mortgage Type
Purchase Money Mortgage
Purchase Details
Closed on
Nov 3, 2005
Sold by
Ramirez Aurelio
Bought by
Wise Steven
Home Financials for this Owner
Home Financials are based on the most recent Mortgage that was taken out on this home.
Original Mortgage
$216,000
Interest Rate
5.85%
Mortgage Type
Purchase Money Mortgage
Purchase Details
Closed on
Oct 2, 2000
Sold by
Ziobro John
Bought by
Ramirez Aurelio
Create a Home Valuation Report for This Property
The Home Valuation Report is an in-depth analysis detailing your home's value as well as a comparison with similar homes in the area
Home Values in the Area
Average Home Value in this Area
Purchase History
| Date | Buyer | Sale Price | Title Company |
|---|---|---|---|
| Mn Estates Llc | -- | -- | |
| Nguyen Michael | -- | -- | |
| Nguyen Huong T | $125,000 | -- | |
| Wise Steven | $270,000 | -- | |
| Ramirez Aurelio | $140,700 | -- |
Source: Public Records
Mortgage History
| Date | Status | Borrower | Loan Amount |
|---|---|---|---|
| Previous Owner | Ramirez Aurelio | $93,750 | |
| Previous Owner | Ramirez Aurelio | $216,000 | |
| Previous Owner | Ramirez Aurelio | $40,500 |
Source: Public Records
Tax History Compared to Growth
Tax History
| Year | Tax Paid | Tax Assessment Tax Assessment Total Assessment is a certain percentage of the fair market value that is determined by local assessors to be the total taxable value of land and additions on the property. | Land | Improvement |
|---|---|---|---|---|
| 2025 | $6,983 | $101,283 | $6,468 | $94,815 |
| 2024 | $6,983 | $101,283 | $6,468 | $94,815 |
| 2023 | $6,983 | $101,283 | $6,468 | $94,815 |
| 2022 | $6,983 | $101,283 | $6,468 | $94,815 |
| 2021 | $5,772 | $77,700 | $8,890 | $68,810 |
| 2020 | $5,772 | $77,700 | $8,890 | $68,810 |
| 2019 | $5,772 | $77,700 | $8,890 | $68,810 |
| 2018 | $5,578 | $75,080 | $8,590 | $66,490 |
| 2016 | $5,520 | $74,308 | $8,181 | $66,127 |
| 2015 | $5,258 | $70,779 | $7,793 | $62,986 |
| 2014 | $5,130 | $69,049 | $7,603 | $61,446 |
Source: Public Records
Map
Nearby Homes
- 17 Giddings St
- 11 Nepaug St
- 729 Broadview Terrace
- 61 Wilbur St
- 0 Stone St
- 25 Cumberland St
- 82 Nepaug St
- 40 Forster St
- 647 Broadview Terrace
- 634 New Britain Ave
- 89 Sequin St
- 937 New Britain Ave
- 111 Coolidge St
- 263 Linnmoore St
- 90 Meriline Ave
- 127 Hollywood Ave
- 120 Nilan St
- 208 Mountain St
- 99 Bristol St
- 148 Princeton St
- 788 New Britain Ave Unit 790
- 800 New Britain Ave
- 784 New Britain Ave Unit 786
- 780 New Britain Ave Unit 782
- 2 Nepaug St
- 14 Giddings St
- 791 New Britain Ave
- 789 New Britain Ave
- 776 New Britain Ave Unit 778
- 806 New Britain Ave Unit 808
- 4 Nepaug St
- 15 Clermont St
- 20 Giddings St
- 8 Nepaug St Unit 10
- 3 Nepaug St
- 17 Clermont St
- 19 Giddings St Unit 21
- 22 Giddings St Unit 24
- 809 New Britain Ave
- 816 New Britain Ave