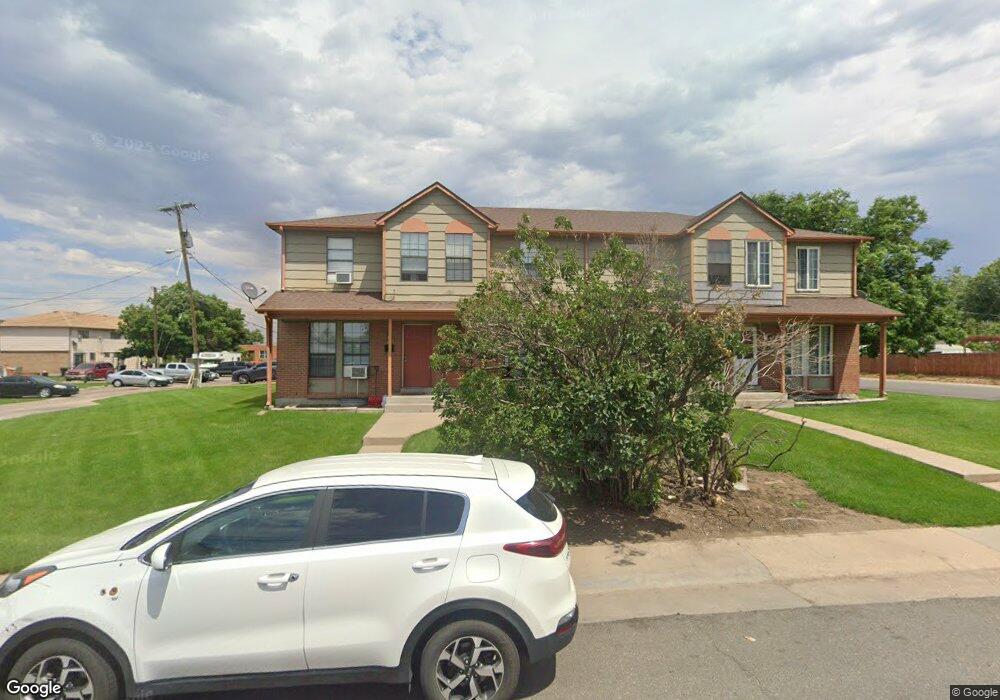
792 S Patton Ct Unit 14 Denver, CO 80219
Westwood NeighborhoodEstimated Value: $334,000 - $395,000
2
Beds
3
Baths
1,023
Sq Ft
$351/Sq Ft
Est. Value
About This Home
This home is located at 792 S Patton Ct Unit 14, Denver, CO 80219 and is currently estimated at $358,563, approximately $350 per square foot. 792 S Patton Ct Unit 14 is a home located in Denver County with nearby schools including Castro Elementary School, Kepner Beacon Middle School, and West High School.
Ownership History
Date
Name
Owned For
Owner Type
Purchase Details
Closed on
Dec 3, 2007
Sold by
Deutsche Bank National Trust Co
Bought by
Thyfault Justin
Current Estimated Value
Home Financials for this Owner
Home Financials are based on the most recent Mortgage that was taken out on this home.
Original Mortgage
$56,700
Outstanding Balance
$35,759
Interest Rate
6.23%
Mortgage Type
Unknown
Estimated Equity
$322,804
Purchase Details
Closed on
May 4, 2007
Sold by
Rivera Justina
Bought by
Deutsche Bank National Trust Co
Purchase Details
Closed on
Mar 16, 2004
Sold by
Rivera Justina M
Bought by
Rivera Justina
Purchase Details
Closed on
Oct 30, 1997
Sold by
Graumann Daniel J
Bought by
Rivera Justina M
Home Financials for this Owner
Home Financials are based on the most recent Mortgage that was taken out on this home.
Original Mortgage
$64,350
Interest Rate
9.75%
Create a Home Valuation Report for This Property
The Home Valuation Report is an in-depth analysis detailing your home's value as well as a comparison with similar homes in the area
Home Values in the Area
Average Home Value in this Area
Purchase History
| Date | Buyer | Sale Price | Title Company |
|---|---|---|---|
| Thyfault Justin | $63,000 | Servicelink Lp | |
| Deutsche Bank National Trust Co | -- | None Available | |
| Rivera Justina | -- | -- | |
| Rivera Justina M | $71,500 | Land Title |
Source: Public Records
Mortgage History
| Date | Status | Borrower | Loan Amount |
|---|---|---|---|
| Open | Thyfault Justin | $56,700 | |
| Previous Owner | Rivera Justina M | $64,350 |
Source: Public Records
Tax History Compared to Growth
Tax History
| Year | Tax Paid | Tax Assessment Tax Assessment Total Assessment is a certain percentage of the fair market value that is determined by local assessors to be the total taxable value of land and additions on the property. | Land | Improvement |
|---|---|---|---|---|
| 2024 | $1,323 | $16,700 | $2,610 | $14,090 |
| 2023 | $1,294 | $16,700 | $2,610 | $14,090 |
| 2022 | $1,284 | $16,140 | $2,630 | $13,510 |
| 2021 | $1,239 | $16,610 | $2,710 | $13,900 |
| 2020 | $1,166 | $15,710 | $2,050 | $13,660 |
| 2019 | $1,133 | $15,710 | $2,050 | $13,660 |
| 2018 | $1,054 | $13,630 | $1,480 | $12,150 |
| 2017 | $1,051 | $13,630 | $1,480 | $12,150 |
| 2016 | $844 | $10,350 | $1,385 | $8,965 |
| 2015 | $809 | $10,350 | $1,385 | $8,965 |
| 2014 | $448 | $5,390 | $812 | $4,578 |
Source: Public Records
Map
Nearby Homes
- 3947 W Ohio Ave Unit 17
- 3918 W Kentucky Ave
- 960 S Perry St
- 3703 W Walsh Place
- 655 S Perry St
- 3503 W Ada Place
- 1057 S Osceola St
- 668 S Lowell Blvd
- 1050 S Quitman St
- 656 S Stuart St
- 671 S Stuart St
- 855 S Knox Ct
- 3470 W Walsh Place
- 538 S Osceola St
- 3570 W Center Ave
- 1075 S Raleigh St
- 1124 S Perry St
- 580 S Quitman St
- 1110 S Quitman St
- 3520 W Center Ave
- 790 S Patton Ct Unit 13
- 794 S Patton Ct Unit 15
- 796 S Patton Ct Unit 16
- 3945 W Ohio Ave Unit 18
- 3943 W Ohio Ave Unit 19
- 3941 W Ohio Ave Unit 20
- 795 S Patton Ct
- 756 S Patton Ct
- 754 S Patton Ct Unit 3
- 754 S Patton Ct
- 754 S Patton Ct Unit 13
- 800 S Patton Ct
- 804 S Patton Ct
- 3937 W Ohio Ave Unit 21
- 752 S Patton Ct Unit 2
- 3935 W Ohio Ave Unit 22
- 750 S Patton Ct Unit 1
- 785 S Patton Ct Unit 787
- 3936 W Walsh Place Unit 8
- 4017 W Ohio Ave Unit 4019