7920 Marsden St Philadelphia, PA 19136
Holmesburg NeighborhoodEstimated payment $1,446/month
Highlights
- Straight Thru Architecture
- 5-minute walk to Holmesburg Junction
- Forced Air Heating and Cooling System
- No HOA
About This Home
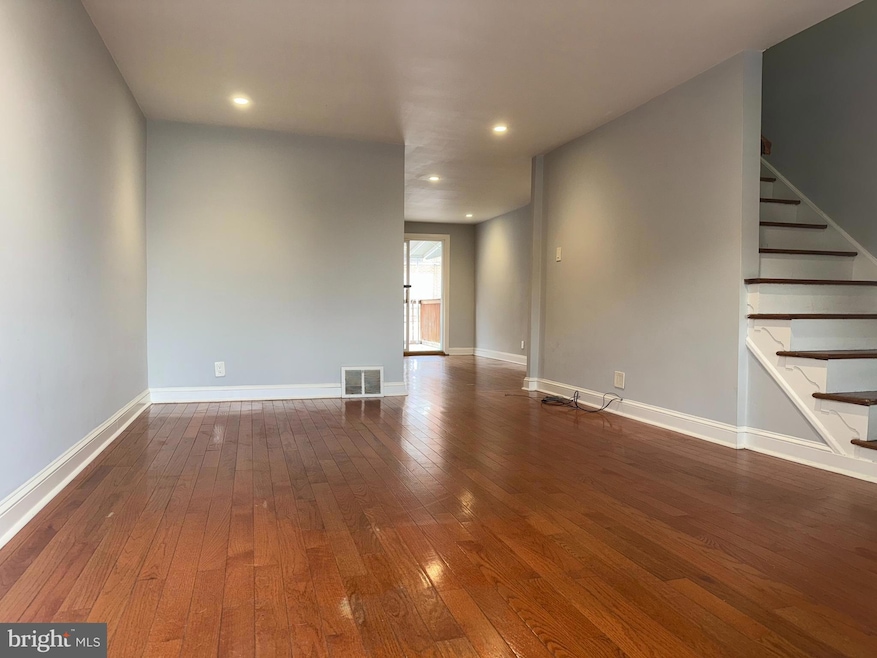
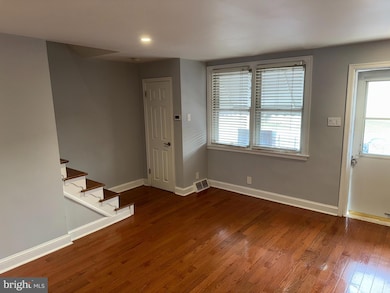
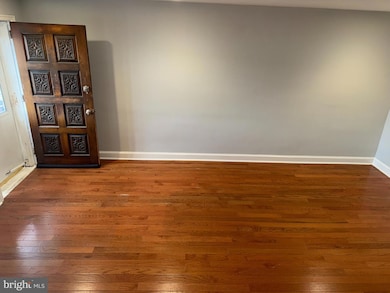
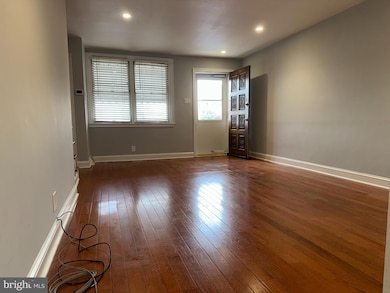
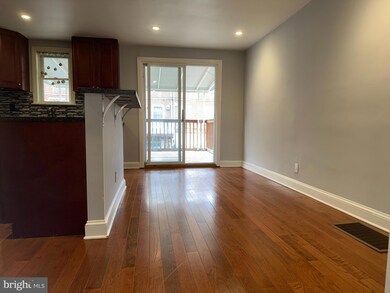
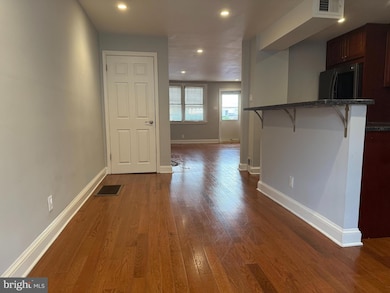
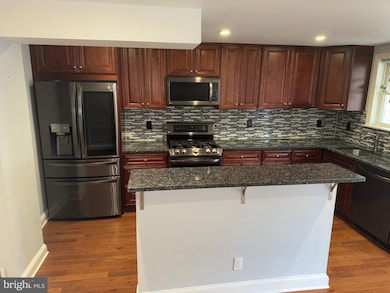
A very nice and modern 3 bedroom home with a Beautiful New Kitchen, Deck, C/A and a Finished Basement! The Front exterior has a fenced in patio. The first floor is open with new hardwood floors, recessed lighting and freshly painted! The Kitchen is on of the nicest on the market which offers more than enough cabinets & counter space with top of the line stainless steel appliances including a double gas oven, a really cool refrigerator and a nice backsplash! Off of the dining room are sliding glass door leading to a large deck.
Upstairs there are the 3 bedrooms all with closets. The basement is Finished for extra living space with a large storage closet, laundry room, newer heater and water heater with an exit to the rear driveway. This home is located just a block away from a school and a park.
Townhouse Details
Home Type
- Townhome
Est. Annual Taxes
- $2,814
Year Built
- Built in 1955
Lot Details
- 1,156 Sq Ft Lot
- Lot Dimensions are 16.00 x 73.00
Home Design
- Straight Thru Architecture
- Masonry
Interior Spaces
- 1,120 Sq Ft Home
- Property has 2 Levels
- Finished Basement
Bedrooms and Bathrooms
- 3 Bedrooms
- 1 Full Bathroom
Parking
- Driveway
- On-Street Parking
Utilities
- Forced Air Heating and Cooling System
- Cooling System Utilizes Natural Gas
- Natural Gas Water Heater
Community Details
- No Home Owners Association
- Holmesburg Subdivision
Listing and Financial Details
- Tax Lot 87
- Assessor Parcel Number 651251900
Map
Home Values in the Area
Average Home Value in this Area
Tax History
| Year | Tax Paid | Tax Assessment Tax Assessment Total Assessment is a certain percentage of the fair market value that is determined by local assessors to be the total taxable value of land and additions on the property. | Land | Improvement |
|---|---|---|---|---|
| 2026 | $2,191 | $201,100 | $40,220 | $160,880 |
| 2025 | $2,191 | $201,100 | $40,220 | $160,880 |
| 2024 | $2,191 | $201,100 | $40,220 | $160,880 |
| 2023 | $2,191 | $156,500 | $31,300 | $125,200 |
| 2022 | $1,788 | $156,500 | $31,300 | $125,200 |
| 2021 | $1,788 | $0 | $0 | $0 |
| 2020 | $1,788 | $0 | $0 | $0 |
| 2019 | $1,732 | $0 | $0 | $0 |
| 2018 | $1,579 | $0 | $0 | $0 |
| 2017 | $1,579 | $0 | $0 | $0 |
| 2016 | $1,579 | $0 | $0 | $0 |
| 2015 | $1,512 | $0 | $0 | $0 |
| 2014 | -- | $112,800 | $16,306 | $96,494 |
| 2012 | -- | $14,112 | $836 | $13,276 |
Property History
| Date | Event | Price | List to Sale | Price per Sq Ft |
|---|---|---|---|---|
| 11/07/2025 11/07/25 | For Sale | $229,888 | -- | $205 / Sq Ft |
Purchase History
| Date | Type | Sale Price | Title Company |
|---|---|---|---|
| Deed | $92,700 | First Plantinu Abstartc Llc | |
| Deed | $63,800 | None Available | |
| Deed | $54,900 | -- |
Mortgage History
| Date | Status | Loan Amount | Loan Type |
|---|---|---|---|
| Open | $74,160 | New Conventional | |
| Previous Owner | $62,644 | FHA |
Source: Bright MLS
MLS Number: PAPH2556246
APN: 651251900
Disclaimer: Certain information contained herein is derived from information provided by parties other than Homes.com. All information provided is deemed reliable, but is not guaranteed to be accurate and should be independently verified.
![]() The data relating to real estate for sale on this website appears in part through the BRIGHT Internet Data Exchange program, a voluntary cooperative exchange of property listing data between licensed real estate brokerage firms, and is provided by BRIGHT through a licensing agreement.
The data relating to real estate for sale on this website appears in part through the BRIGHT Internet Data Exchange program, a voluntary cooperative exchange of property listing data between licensed real estate brokerage firms, and is provided by BRIGHT through a licensing agreement.
Listing information is from various brokers who participate in the Bright MLS IDX program and not all listings may be visible on the site.
The property information being provided on or through the website is for the personal, non-commercial use of consumers and such information may not be used for any purpose other than to identify prospective properties consumers may be interested in purchasing.
Some properties which appear for sale on the website may no longer be available because they are for instance, under contract, sold or are no longer being offered for sale.
Property information displayed is deemed reliable but is not guaranteed.
Copyright 2025 Bright MLS, Inc.
- 4624 Rhawn St
- 4602 Ashville St
- 4626 Ashville St
- 4747 Hartel Ave
- 4314 Rhawn St
- 8030 Ditman St Unit 134X
- 8030 Ditman St Unit 88P
- 4312 Rhawn St
- 4702 Lansing St
- 4415 Mcmenamy St
- 4727 Meridian St
- 4745 Meridian St
- 4406 Mcmenamy St
- 4246 Rhawn St
- 4243 Frost St
- 4228 Hartel Ave
- 4520 Sheffield St
- 4228 Rhawn St
- 4424 Sheffield Ave
- 4556 Marple St
- 4405-4415 Decatur St
- 4731 Meridian St
- 4411 Sheffield Ave Unit 11
- 4434 Marple St
- 4127 Rhawn St
- 4440 Shelmire Ave Unit B
- 4440 Shelmire Ave Unit B
- 4737 Vista St
- 8128 Ditman St Unit 1
- 8139 Frankford Ave Unit 3
- 4018 Chippendale Ave
- 8231-8239 Frankford Ave
- 4020 Loring St
- 4241 Aldine St Unit 2nd Floor
- 3541 Vista St Unit 2
- 7240 Gillespie St Unit 2FL
- 7241 Cottage St
- 7208 Torresdale Ave Unit 2
- 7208 Torresdale Ave Unit 1
- 4224 Cottman Ave Unit 1ST FL
