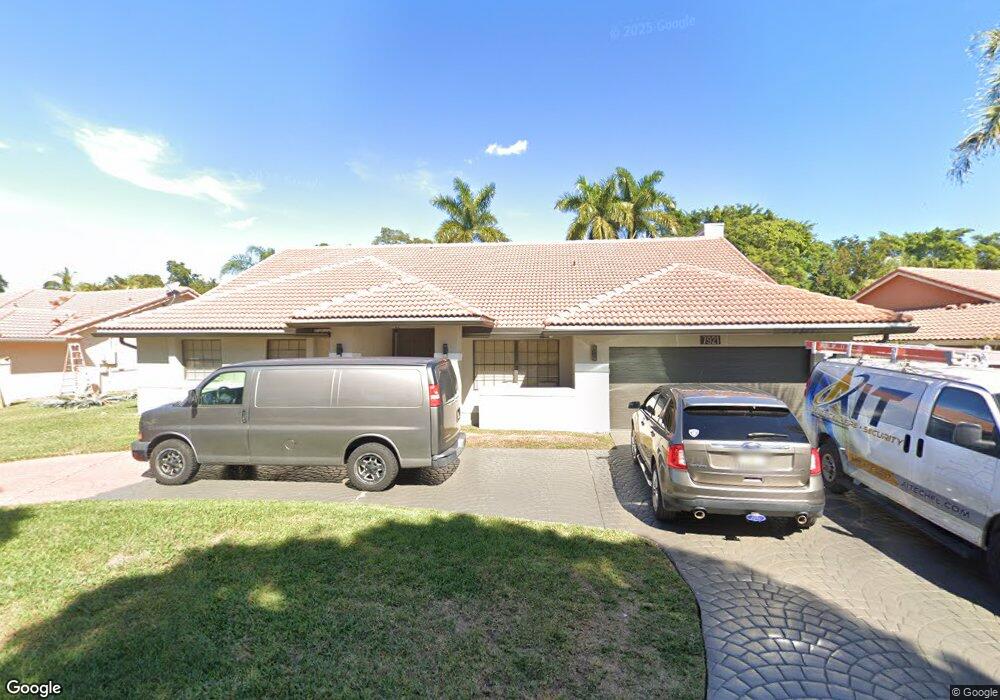
7921 NW 83rd St Tamarac, FL 33321
Woodmont NeighborhoodEstimated Value: $749,000 - $807,000
4
Beds
3
Baths
2,744
Sq Ft
$282/Sq Ft
Est. Value
About This Home
This home is located at 7921 NW 83rd St, Tamarac, FL 33321 and is currently estimated at $774,133, approximately $282 per square foot. 7921 NW 83rd St is a home located in Broward County with nearby schools including Tamarac Elementary School, Millennium Middle School, and J. P. Taravella High School.
Ownership History
Date
Name
Owned For
Owner Type
Purchase Details
Closed on
Sep 12, 2019
Sold by
Selvaggio Michael and Castro Eleanor
Bought by
Manns Joseph and Manns Keri A
Current Estimated Value
Home Financials for this Owner
Home Financials are based on the most recent Mortgage that was taken out on this home.
Original Mortgage
$280,000
Interest Rate
3.7%
Mortgage Type
New Conventional
Purchase Details
Closed on
Jan 11, 2017
Sold by
Selvaggio Michael
Bought by
Selvaggo Michael
Purchase Details
Closed on
Jan 1, 2017
Bought by
Michael
Purchase Details
Closed on
Aug 10, 1998
Sold by
Stockstill Gregory I and Stockstill Ursula R
Bought by
Selvaggio Michael
Purchase Details
Closed on
Dec 21, 1993
Sold by
Briesemeister Mark R and Briesemeister Cheryl L
Bought by
Stockstill Gregory I and Stockstill Ursula R
Home Financials for this Owner
Home Financials are based on the most recent Mortgage that was taken out on this home.
Original Mortgage
$203,150
Interest Rate
7.09%
Create a Home Valuation Report for This Property
The Home Valuation Report is an in-depth analysis detailing your home's value as well as a comparison with similar homes in the area
Home Values in the Area
Average Home Value in this Area
Purchase History
| Date | Buyer | Sale Price | Title Company |
|---|---|---|---|
| Manns Joseph | $350,000 | Team Title Usa Llc | |
| Selvaggo Michael | -- | Attorney | |
| Michael | $100 | -- | |
| Selvaggio Michael | $250,000 | -- | |
| Stockstill Gregory I | $260,000 | -- |
Source: Public Records
Mortgage History
| Date | Status | Borrower | Loan Amount |
|---|---|---|---|
| Previous Owner | Manns Joseph | $280,000 | |
| Previous Owner | Stockstill Gregory I | $203,150 |
Source: Public Records
Tax History Compared to Growth
Tax History
| Year | Tax Paid | Tax Assessment Tax Assessment Total Assessment is a certain percentage of the fair market value that is determined by local assessors to be the total taxable value of land and additions on the property. | Land | Improvement |
|---|---|---|---|---|
| 2025 | $10,037 | $489,450 | -- | -- |
| 2024 | $9,847 | $475,660 | -- | -- |
| 2023 | $9,847 | $461,810 | $0 | $0 |
| 2022 | $9,351 | $448,360 | $0 | $0 |
| 2021 | $9,166 | $435,310 | $0 | $0 |
| 2020 | $9,930 | $470,710 | $53,670 | $417,040 |
| 2019 | $8,162 | $435,620 | $53,670 | $381,950 |
| 2018 | $10,059 | $437,540 | $53,670 | $383,870 |
| 2017 | $4,889 | $255,910 | $0 | $0 |
| 2016 | $5,033 | $250,650 | $0 | $0 |
| 2015 | $5,025 | $248,910 | $0 | $0 |
| 2014 | $5,050 | $246,940 | $0 | $0 |
| 2013 | -- | $267,310 | $53,670 | $213,640 |
Source: Public Records
Map
Nearby Homes
- 8258 NW 79th Ave
- 8220 Waterford Ln
- 8271 Cassia Terrace
- 8353 Waterford Ave
- 9919 SW 1st Ct
- 8365 Waterford Cir Unit 2
- 8465 Waterford Cir
- 10180 SW 1st Ct
- 9537 SW 1st Ct Unit 9537
- 8208 NW 80th St
- 9592 SW 1st Ct Unit 13F
- 10419 NW 1st Ct
- 10419 NW 1st Place
- 9924 NW 3rd Place
- 7900 NW 79th Terrace
- 8532 W Southgate Shores Cir
- 9468 NW 2nd St
- 8160 NW 78th St
- 8203 NW 73rd Terrace
- 8706 NW 83rd St
- 7925 NW 83rd St
- 7917 NW 83rd St
- 7924 NW 83rd St
- 7929 NW 83rd St
- 7913 NW 83rd St
- 7920 NW 83rd St
- 7928 NW 83rd St
- 7916 NW 83rd St
- 7932 NW 83rd St
- 8001 NW 83rd St
- 7909 NW 83rd St
- 7912 NW 83rd St
- 8000 NW 83rd St
- 7908 NW 83rd St
- 7905 NW 83rd St
- 8005 NW 83rd St
- 8004 NW 83rd St
- 7904 NW 83rd St
- 7901 NW 83rd St
- 8009 NW 83rd St