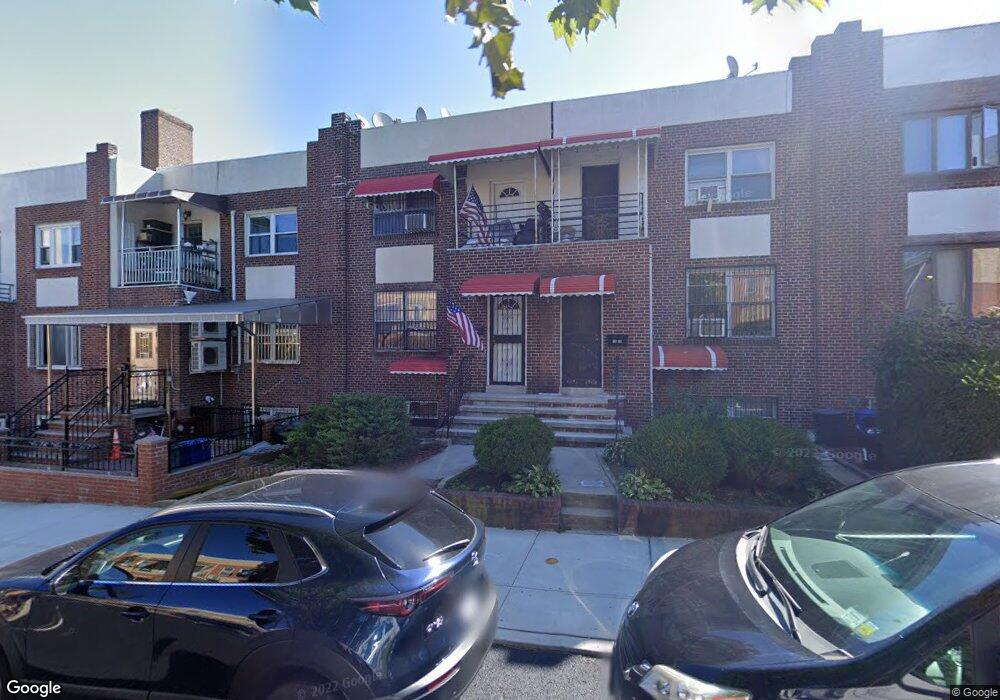
7922 Ankener Ave Elmhurst, NY 11373
Maspeth NeighborhoodEstimated Value: $1,061,000 - $1,335,000
--
Bed
--
Bath
2,025
Sq Ft
$585/Sq Ft
Est. Value
About This Home
This home is located at 7922 Ankener Ave, Elmhurst, NY 11373 and is currently estimated at $1,185,590, approximately $585 per square foot. 7922 Ankener Ave is a home located in Queens County with nearby schools including Ps 58 School Of Heroes, IS 73 - The Frank Sansivieri School, and Newtown High School.
Ownership History
Date
Name
Owned For
Owner Type
Purchase Details
Closed on
Jul 9, 2025
Sold by
Cheng Kee
Bought by
Cheng Kee and Cheung-Cheng Ivy
Current Estimated Value
Purchase Details
Closed on
Jun 28, 2017
Sold by
Li Dan Gui and Li Zhi Ren
Bought by
Cheng Kee
Home Financials for this Owner
Home Financials are based on the most recent Mortgage that was taken out on this home.
Original Mortgage
$435,000
Outstanding Balance
$360,258
Interest Rate
3.95%
Mortgage Type
New Conventional
Estimated Equity
$825,332
Purchase Details
Closed on
Oct 11, 1996
Sold by
Leung Kin Wah
Bought by
Li Zhi Ren and Li Dan Gui
Home Financials for this Owner
Home Financials are based on the most recent Mortgage that was taken out on this home.
Original Mortgage
$140,000
Interest Rate
7.83%
Purchase Details
Closed on
Dec 30, 1994
Sold by
Leung Wing Yim
Bought by
Leung Kin Wah
Create a Home Valuation Report for This Property
The Home Valuation Report is an in-depth analysis detailing your home's value as well as a comparison with similar homes in the area
Home Values in the Area
Average Home Value in this Area
Purchase History
| Date | Buyer | Sale Price | Title Company |
|---|---|---|---|
| Cheng Kee | -- | -- | |
| Cheng Kee | $785,000 | -- | |
| Cheng Kee | $785,000 | -- | |
| Cheng Kee | $785,000 | -- | |
| Li Zhi Ren | $220,000 | -- | |
| Li Zhi Ren | $220,000 | -- | |
| Leung Kin Wah | -- | -- | |
| Leung Kin Wah | -- | -- |
Source: Public Records
Mortgage History
| Date | Status | Borrower | Loan Amount |
|---|---|---|---|
| Open | Cheng Kee | $435,000 | |
| Closed | Cheng Kee | $435,000 | |
| Previous Owner | Li Zhi Ren | $140,000 |
Source: Public Records
Tax History Compared to Growth
Tax History
| Year | Tax Paid | Tax Assessment Tax Assessment Total Assessment is a certain percentage of the fair market value that is determined by local assessors to be the total taxable value of land and additions on the property. | Land | Improvement |
|---|---|---|---|---|
| 2025 | $8,996 | $47,177 | $12,266 | $34,911 |
| 2024 | $8,996 | $44,789 | $13,129 | $31,660 |
| 2023 | $8,560 | $42,618 | $10,601 | $32,017 |
| 2022 | $8,027 | $61,620 | $17,940 | $43,680 |
| 2021 | $8,462 | $58,800 | $17,940 | $40,860 |
| 2020 | $8,322 | $50,580 | $17,940 | $32,640 |
| 2019 | $7,808 | $52,440 | $17,940 | $34,500 |
| 2018 | $7,240 | $35,515 | $13,791 | $21,724 |
| 2017 | $6,831 | $33,508 | $12,263 | $21,245 |
| 2016 | $6,699 | $33,508 | $12,263 | $21,245 |
| 2015 | $3,593 | $32,762 | $13,981 | $18,781 |
| 2014 | $3,593 | $31,104 | $15,936 | $15,168 |
Source: Public Records
Map
Nearby Homes
- 79-10 Grand Ave
- 79-19 Calamus Ave
- 79-15 Kneeland Ave
- 74-49 Calamus Ave Unit 51
- 74-47 Calamus Ave Unit 48
- 52-57 84th St
- 84-38 Grand Ave
- 74-29 Calamus Ave Unit 20
- 5434 83rd St
- 73-37 52nd Ave
- 7332 53rd Rd
- 5119 Ireland St
- 86-04 Grand Ave Unit 2D
- 5745 74th St Unit 306
- 52-79 72nd St
- 5359 72nd Place
- 76-22 57th Rd
- 81-14 Queens Blvd Unit PH6C
- 57-18 73rd St
- 51-21 Goldsmith St
- 7924 Ankener Ave
- 7924 Ankener Ave
- 7922 Ankener Ave Unit 1
- 7922 Ankener Ave Unit 2
- 7922 Ankener Ave
- 7926 Ankener Ave
- 7920 Ankener Ave
- 52-02 82nd St
- 5202 82nd St
- 5202 82nd St Unit 2
- 5204 82nd St
- 7918 Ankener Ave
- 7916 Ankener Ave
- 5212 82nd St
- 7914 Ankener Ave
- 7945 Grand Ave
- 7943 Grand Ave
- 7911 Ankener Ave
- 5216 82nd St
- 7947 Grand Ave