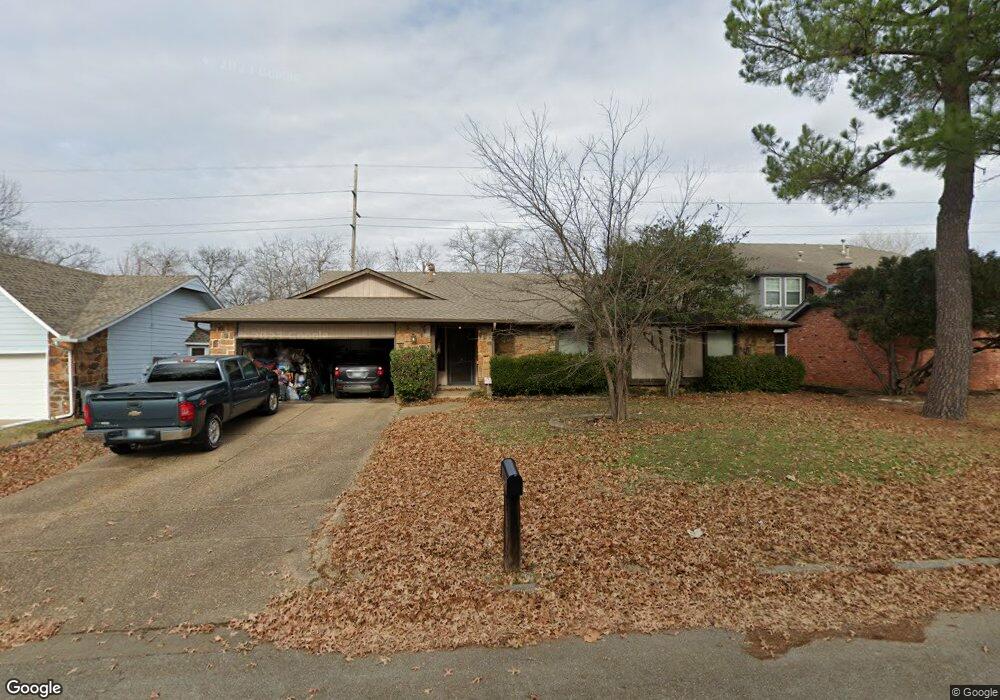
7923 E 77th St Tulsa, OK 74133
Sheridan Valley NeighborhoodEstimated Value: $255,953 - $290,000
3
Beds
2
Baths
2,009
Sq Ft
$135/Sq Ft
Est. Value
About This Home
This home is located at 7923 E 77th St, Tulsa, OK 74133 and is currently estimated at $271,988, approximately $135 per square foot. 7923 E 77th St is a home located in Tulsa County with nearby schools including Jarman Elementary School, Union 6th-7th Grade Center, and Union 8th Grade Center.
Ownership History
Date
Name
Owned For
Owner Type
Purchase Details
Closed on
Sep 19, 2013
Sold by
Wilson Chalice Marie and Wilson Chalice M
Bought by
Wilson Chalice M and Wilson Paul
Current Estimated Value
Home Financials for this Owner
Home Financials are based on the most recent Mortgage that was taken out on this home.
Original Mortgage
$109,750
Outstanding Balance
$81,595
Interest Rate
4.46%
Mortgage Type
New Conventional
Estimated Equity
$190,393
Purchase Details
Closed on
Feb 18, 2010
Sold by
Hannaford Chalice M and Wilson Chalice Marie
Bought by
Wilson Chalice Marie and Wilson Paul
Home Financials for this Owner
Home Financials are based on the most recent Mortgage that was taken out on this home.
Original Mortgage
$108,000
Interest Rate
5.05%
Mortgage Type
New Conventional
Purchase Details
Closed on
Oct 22, 1997
Sold by
Hunt J Richard
Bought by
Hannaford Chalice M
Create a Home Valuation Report for This Property
The Home Valuation Report is an in-depth analysis detailing your home's value as well as a comparison with similar homes in the area
Home Values in the Area
Average Home Value in this Area
Purchase History
| Date | Buyer | Sale Price | Title Company |
|---|---|---|---|
| Wilson Chalice M | -- | Firstitle & Abstract | |
| Wilson Chalice Marie | -- | None Available | |
| Hannaford Chalice M | $101,000 | Delta Title & Escrow Company |
Source: Public Records
Mortgage History
| Date | Status | Borrower | Loan Amount |
|---|---|---|---|
| Open | Wilson Chalice M | $109,750 | |
| Closed | Wilson Chalice Marie | $108,000 |
Source: Public Records
Tax History
| Year | Tax Paid | Tax Assessment Tax Assessment Total Assessment is a certain percentage of the fair market value that is determined by local assessors to be the total taxable value of land and additions on the property. | Land | Improvement |
|---|---|---|---|---|
| 2025 | $2,194 | $16,048 | $1,754 | $14,294 |
| 2024 | $1,927 | $15,551 | $1,665 | $13,886 |
| 2023 | $1,927 | $16,070 | $1,921 | $14,149 |
| 2022 | $1,945 | $14,601 | $2,406 | $12,195 |
| 2021 | $1,909 | $14,147 | $2,331 | $11,816 |
| 2020 | $1,823 | $13,705 | $2,258 | $11,447 |
| 2019 | $1,828 | $13,278 | $2,188 | $11,090 |
| 2018 | $1,766 | $12,861 | $2,807 | $10,054 |
| 2017 | $1,721 | $13,458 | $2,937 | $10,521 |
| 2016 | $1,683 | $13,458 | $2,937 | $10,521 |
| 2015 | $1,701 | $13,458 | $2,937 | $10,521 |
| 2014 | $1,649 | $13,266 | $2,937 | $10,329 |
Source: Public Records
Map
Nearby Homes
- 8126 E 74th Ct
- 7606 E 77th St
- 8410 E 74th Ct
- 7409 S 84th East Ave
- 7802 E 79th St
- 8507 E 78th St
- 7830 S 85th East Ave
- 8509 E 78th Place
- 7932 S 86th East Ave
- 8019 S 77th East Ave
- 7912 S 87th East Ave
- 8323 E 81st Place
- 7505 S 70th East Ave
- 7936 S 90th East Ave
- 7944 S 90th Ave E
- 8007 S 88th East Ave
- 6915 S 77th East Ave
- 7805 S 70th East Ave
- 7127 E 80th St
- 6985 E 72nd St
- 7929 E 77th St
- 0 S 80th St Unit 2401332
- 0 S 80th St Unit 1941545
- 9248 S 80th East Ave
- 9237 S 80th East Ave
- 7935 E 77th St
- 7918 E 77th St
- 7924 E 77th St
- 7912 E 77th St
- 7941 E 77th St
- 7905 E 77th St
- 7701 S 80th East Ave
- 7906 E 77th St
- 7823 E 77th St
- 7707 S 80th East Ave
- 7921 E 77th Place
- 7927 E 77th Place
- 7826 E 77th St
- 7913 E 77th Place
Your Personal Tour Guide
Ask me questions while you tour the home.