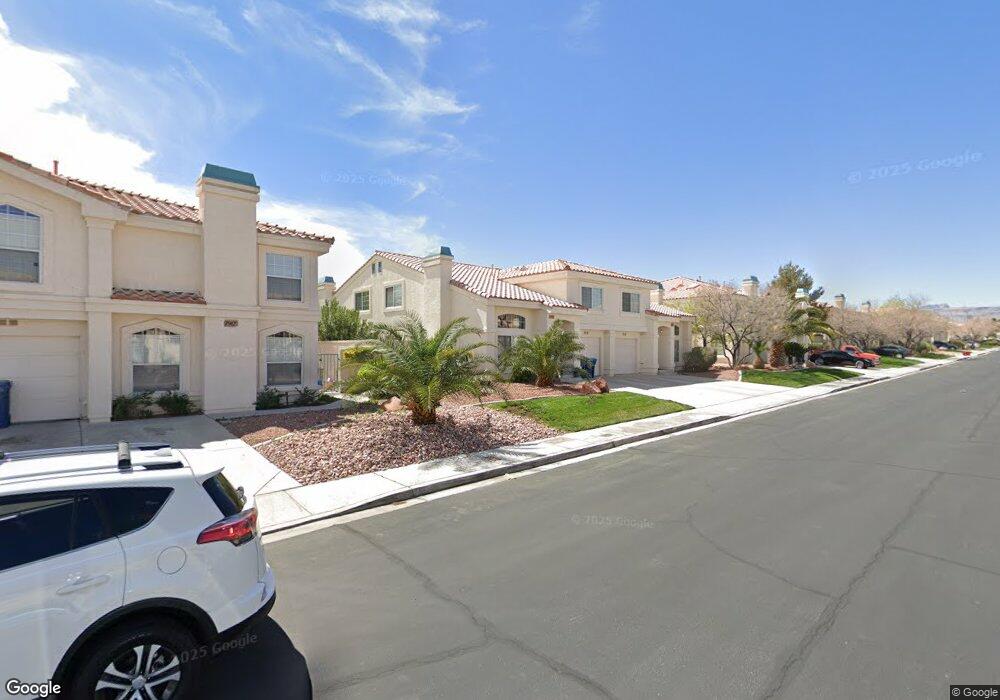
7923 Lisa Dawn Ave Las Vegas, NV 89147
Rancho Viejo NeighborhoodEstimated Value: $329,373 - $362,000
2
Beds
3
Baths
1,287
Sq Ft
$266/Sq Ft
Est. Value
About This Home
This home is located at 7923 Lisa Dawn Ave, Las Vegas, NV 89147 and is currently estimated at $342,343, approximately $266 per square foot. 7923 Lisa Dawn Ave is a home located in Clark County with nearby schools including Roger M Bryan Elementary School, Clifford J Lawrence Junior High School, and Spring Valley High School.
Ownership History
Date
Name
Owned For
Owner Type
Purchase Details
Closed on
Nov 18, 2010
Sold by
Miner Patrick Dennis
Bought by
Gianakas Nicholas A and Gianakas Nazic
Current Estimated Value
Purchase Details
Closed on
Jan 15, 2004
Sold by
Angotti Holly and Kindler Holly
Bought by
Miner Patrick Dennis
Home Financials for this Owner
Home Financials are based on the most recent Mortgage that was taken out on this home.
Original Mortgage
$149,785
Interest Rate
6.02%
Mortgage Type
VA
Purchase Details
Closed on
Oct 17, 1997
Sold by
Davis Cheryl
Bought by
Kindler Holly
Home Financials for this Owner
Home Financials are based on the most recent Mortgage that was taken out on this home.
Original Mortgage
$97,597
Interest Rate
7.23%
Mortgage Type
FHA
Purchase Details
Closed on
Mar 22, 1996
Sold by
Hazel Murray Ltd
Bought by
Davis Cheryl
Home Financials for this Owner
Home Financials are based on the most recent Mortgage that was taken out on this home.
Original Mortgage
$86,350
Interest Rate
6.98%
Create a Home Valuation Report for This Property
The Home Valuation Report is an in-depth analysis detailing your home's value as well as a comparison with similar homes in the area
Home Values in the Area
Average Home Value in this Area
Purchase History
| Date | Buyer | Sale Price | Title Company |
|---|---|---|---|
| Gianakas Nicholas A | $90,000 | Equity Title Of Nevada | |
| Miner Patrick Dennis | $145,000 | Lawyers Title Of Nevada | |
| Angotti Holly | -- | Lawyers Title Of Nevada | |
| Kindler Holly | $98,500 | Lawyers Title | |
| Davis Cheryl | $91,000 | National Title Company |
Source: Public Records
Mortgage History
| Date | Status | Borrower | Loan Amount |
|---|---|---|---|
| Previous Owner | Miner Patrick Dennis | $149,785 | |
| Previous Owner | Kindler Holly | $97,597 | |
| Previous Owner | Davis Cheryl | $86,350 |
Source: Public Records
Tax History Compared to Growth
Tax History
| Year | Tax Paid | Tax Assessment Tax Assessment Total Assessment is a certain percentage of the fair market value that is determined by local assessors to be the total taxable value of land and additions on the property. | Land | Improvement |
|---|---|---|---|---|
| 2025 | $1,460 | $70,028 | $26,950 | $43,078 |
| 2024 | $1,352 | $70,028 | $26,950 | $43,078 |
| 2023 | $1,352 | $64,974 | $25,550 | $39,424 |
| 2022 | $900 | $58,188 | $20,650 | $37,538 |
| 2021 | $1,160 | $49,976 | $19,250 | $30,726 |
| 2020 | $1,074 | $51,030 | $18,900 | $32,130 |
| 2019 | $1,007 | $48,071 | $16,100 | $31,971 |
| 2018 | $961 | $43,619 | $12,950 | $30,669 |
| 2017 | $1,241 | $41,967 | $11,550 | $30,417 |
| 2016 | $900 | $39,793 | $9,450 | $30,343 |
| 2015 | $897 | $36,436 | $6,650 | $29,786 |
| 2014 | $870 | $28,407 | $6,300 | $22,107 |
Source: Public Records
Map
Nearby Homes
- 7963 Laurena Ave
- 7971 Lisa Dawn Ave
- 7924 Bridgefield Ln
- 7981 Dorinda Ave Unit n/a
- 4308 Apex Dr
- 8065 Cimarron Meadows Way
- 4404 Elk Point Cir Unit 6
- 4484 Warbonnet Way
- 7932 Barntucket Ave
- 4411 Elk Point Cir
- 7869 Barntucket Ave
- 7885 W Flamingo Rd Unit 1061
- 7885 W Flamingo Rd Unit 1113
- 7885 W Flamingo Rd Unit 1115
- 7885 W Flamingo Rd Unit 1016
- 7885 W Flamingo Rd Unit 1050
- 7885 W Flamingo Rd Unit 2153
- 7885 W Flamingo Rd Unit 2005
- 7885 W Flamingo Rd Unit 1127
- 7885 W Flamingo Rd Unit 1131
- 7917 Lisa Dawn Ave
- 7929 Lisa Dawn Ave Unit 4
- 7922 Delbonita Ave
- 7916 Delbonita Ave
- 7928 Delbonita Ave
- 7935 Lisa Dawn Ave
- 7911 Lisa Dawn Ave
- 7934 Delbonita Ave Unit 4
- 7910 Delbonita Ave
- 7910 Delbonita Ave Unit n/a
- 7920 Lisa Dawn Ave
- 7926 Lisa Dawn Ave Unit n/a
- 7926 Lisa Dawn Ave Unit 4
- 7916 Lisa Dawn Ave
- 7914 Lisa Dawn Ave
- 7941 Lisa Dawn Ave
- 7932 Lisa Dawn Ave
- 7908 Lisa Dawn Ave
- 7940 Delbonita Ave
- 7921 Delbonita Ave