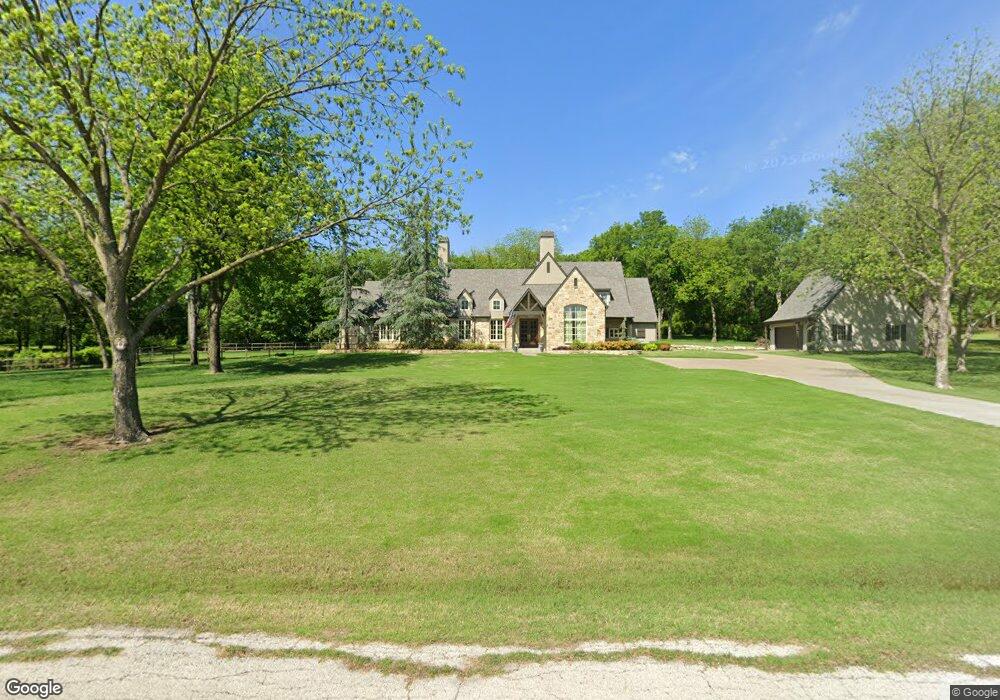
7924 S 28th West Ave Tulsa, OK 74132
West Highlands-Tulsa Hills NeighborhoodEstimated Value: $424,000 - $718,000
3
Beds
2
Baths
1,980
Sq Ft
$309/Sq Ft
Est. Value
About This Home
This home is located at 7924 S 28th West Ave, Tulsa, OK 74132 and is currently estimated at $611,897, approximately $309 per square foot. 7924 S 28th West Ave is a home located in Tulsa County with nearby schools including Jenks West Intermediate Elementary School, Jenks Middle School, and Jenks High School.
Ownership History
Date
Name
Owned For
Owner Type
Purchase Details
Closed on
May 24, 2016
Sold by
Hoffman Christopher P and Hoffman Amy S
Bought by
Hoffman Christopher P and Hoffman Amy S
Current Estimated Value
Purchase Details
Closed on
Jan 11, 2010
Sold by
Federal National Mortgage Association
Bought by
Hoffman Christopher P and Hoffman Amy S
Home Financials for this Owner
Home Financials are based on the most recent Mortgage that was taken out on this home.
Original Mortgage
$120,497
Interest Rate
4.76%
Mortgage Type
Construction
Purchase Details
Closed on
Sep 8, 2009
Sold by
Dolan Colleen M
Bought by
Federal National Mortgage Association
Purchase Details
Closed on
Dec 1, 1993
Create a Home Valuation Report for This Property
The Home Valuation Report is an in-depth analysis detailing your home's value as well as a comparison with similar homes in the area
Home Values in the Area
Average Home Value in this Area
Purchase History
| Date | Buyer | Sale Price | Title Company |
|---|---|---|---|
| Hoffman Christopher P | -- | None Available | |
| Hoffman Christopher P | -- | Firstitle & Abstract Service | |
| Federal National Mortgage Association | -- | None Available | |
| -- | $39,000 | -- |
Source: Public Records
Mortgage History
| Date | Status | Borrower | Loan Amount |
|---|---|---|---|
| Closed | Hoffman Christopher P | $120,497 |
Source: Public Records
Tax History Compared to Growth
Tax History
| Year | Tax Paid | Tax Assessment Tax Assessment Total Assessment is a certain percentage of the fair market value that is determined by local assessors to be the total taxable value of land and additions on the property. | Land | Improvement |
|---|---|---|---|---|
| 2024 | $6,639 | $51,388 | $3,168 | $48,220 |
| 2023 | $6,639 | $50,863 | $4,691 | $46,172 |
| 2022 | $6,643 | $48,381 | $4,462 | $43,919 |
| 2021 | $6,534 | $46,942 | $4,329 | $42,613 |
| 2020 | $6,396 | $46,942 | $4,329 | $42,613 |
| 2019 | $6,614 | $46,942 | $4,329 | $42,613 |
| 2018 | $6,456 | $45,855 | $4,229 | $41,626 |
| 2017 | $6,116 | $45,490 | $4,195 | $41,295 |
| 2016 | $5,957 | $44,165 | $4,235 | $39,930 |
| 2015 | $6,069 | $44,165 | $4,235 | $39,930 |
| 2014 | $5,637 | $41,195 | $4,235 | $36,960 |
Source: Public Records
Map
Nearby Homes
- 3022 W 81st St
- 7964 S 33rd West Ave
- 7970 S 23rd West Ave
- 7637 S 26th West Ave
- 7785 Forest Ln
- 3402 Redbud Ln
- 3404 Redbud Ln
- 3406 Redbud Ln
- 3408 Redbud Ln
- 3410 Redbud Ln
- 7778 Forest Ln
- 0 W 81st St S Unit 2542086
- 3502 Redbud Ln
- 3416 Redbud Ln
- 3504 Redbud Ln
- 3520 W 77th St S
- 7810 S Union Ave
- 8415 S Elwood
- 2125 W 73rd St
- 3263 W 72nd St
- 7936 S 28th West Ave
- 7840 S 28th West Ave
- 7855 S 30th West Ave
- 2626 W 79th St
- 7845 S 30th West Ave
- 8015 S 28th West Ave
- 7885 S 30th West Ave
- 2627 W 79th St
- 7804 S 28th West Ave
- 2801 W 81st St
- 3018 W 79th St
- 2951 W 81st St
- 3029 W 79th St
- 2828 W 78th St
- 7910 S 26th West Ave
- 7940 S 30th West Ave
- 8025 S 28th Ave W
- 7803 S 28th West Ave
- 7930 S 26th West Ave
- 7930 S 26th West Ave