Estimated Value: $385,000 - $503,276
Studio
4
Baths
3,266
Sq Ft
$134/Sq Ft
Est. Value
About This Home
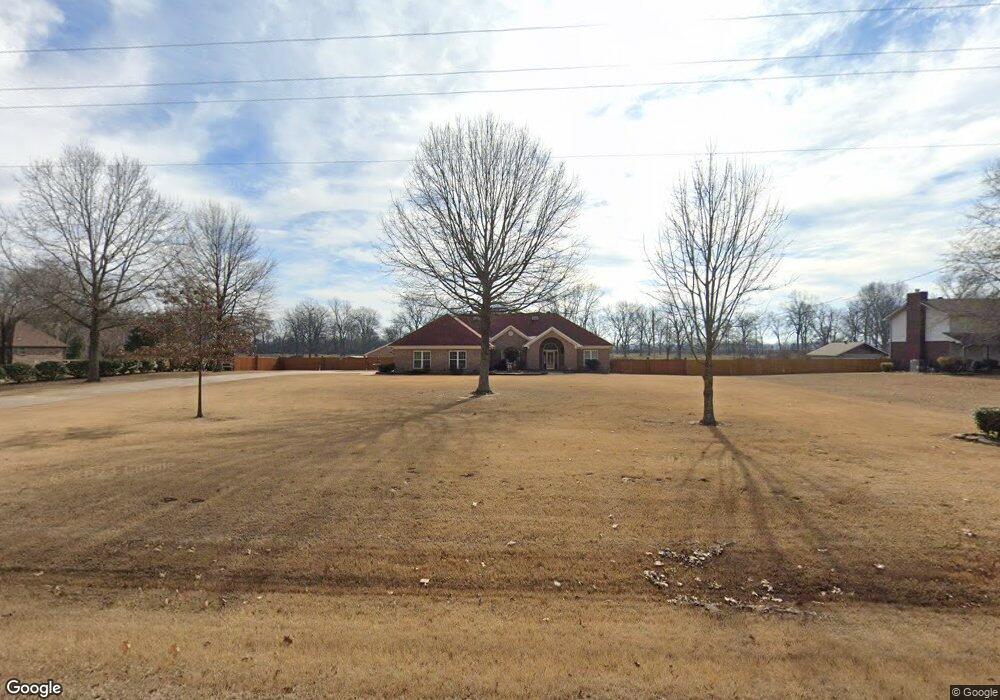
This home is located at 7925 Colonel Maynard Rd, Scott, AR 72142 and is currently estimated at $436,569, approximately $133 per square foot. 7925 Colonel Maynard Rd is a home located in Pulaski County with nearby schools including Harris Elementary School and Mills University Studies High School.
Ownership History
Date
Name
Owned For
Owner Type
Purchase Details
Closed on
Jun 27, 1997
Sold by
Chapman Donald R and Chapman Terresa
Bought by
Akins Henry
Current Estimated Value
Home Financials for this Owner
Home Financials are based on the most recent Mortgage that was taken out on this home.
Original Mortgage
$20,000
Interest Rate
7.85%
Mortgage Type
Purchase Money Mortgage
Purchase Details
Closed on
May 12, 1997
Sold by
Bank Of England
Bought by
Chapman Donald R and Chapman Terresa
Home Financials for this Owner
Home Financials are based on the most recent Mortgage that was taken out on this home.
Original Mortgage
$20,000
Interest Rate
7.85%
Mortgage Type
Purchase Money Mortgage
Purchase Details
Closed on
May 9, 1997
Sold by
Chapman Carl W and Chapman Paulette
Bought by
Chapman Donald R and Chapman Terresa
Home Financials for this Owner
Home Financials are based on the most recent Mortgage that was taken out on this home.
Original Mortgage
$20,000
Interest Rate
7.85%
Mortgage Type
Purchase Money Mortgage
Create a Home Valuation Report for This Property
The Home Valuation Report is an in-depth analysis detailing your home's value as well as a comparison with similar homes in the area
Home Values in the Area
Average Home Value in this Area
Purchase History
| Date | Buyer | Sale Price | Title Company |
|---|---|---|---|
| Akins Henry | $40,000 | Beach Abstract & Guaranty Co | |
| Chapman Donald R | -- | Beach Abstract & Guaranty Co | |
| Chapman Donald R | -- | Beach Abstract & Guaranty Co |
Source: Public Records
Mortgage History
| Date | Status | Borrower | Loan Amount |
|---|---|---|---|
| Closed | Akins Henry | $20,000 |
Source: Public Records
Tax History
| Year | Tax Paid | Tax Assessment Tax Assessment Total Assessment is a certain percentage of the fair market value that is determined by local assessors to be the total taxable value of land and additions on the property. | Land | Improvement |
|---|---|---|---|---|
| 2025 | $1,884 | $60,326 | $6,264 | $54,062 |
| 2024 | $1,884 | $52,156 | $6,260 | $45,896 |
| 2023 | $1,884 | $52,156 | $6,260 | $45,896 |
| 2022 | $2,158 | $52,156 | $6,260 | $45,896 |
| 2021 | $2,104 | $42,530 | $5,220 | $37,310 |
| 2020 | $1,729 | $42,530 | $5,220 | $37,310 |
| 2019 | $1,719 | $42,530 | $5,220 | $37,310 |
| 2018 | $1,744 | $42,530 | $5,220 | $37,310 |
| 2017 | $1,744 | $42,530 | $5,220 | $37,310 |
| 2016 | $1,726 | $37,340 | $5,000 | $32,340 |
| 2015 | $1,884 | $37,093 | $5,000 | $32,093 |
| 2014 | $1,884 | $37,340 | $5,000 | $32,340 |
Source: Public Records
Map
Nearby Homes
- 11407 Youngblood Trail
- 0 Colonel Maynard Rd Unit 26005250
- 0 Colonel Maynard Rd Unit 26005254
- 0 Colonel Maynard Rd Unit 26005249
- 0 Colonel Maynard Rd Unit 26005251
- 0 Colonel Maynard Rd Unit 26005253
- 0 Colonel Maynard Rd Unit 26005252
- 13118 Old River Dr
- 13203 Old River Dr
- LOT 5 Craig Rd
- 12904 Smarty Jones Dr
- 11020 Craig Rd
- 11024 Craig Rd
- 11100 Craig Rd
- 13319 Smarty Jones Dr
- 13129 Smarty Jones Dr
- 14420 Upper Steel Bend Rd
- 00 Upper Steel Bend Rd
- 7918 Blue Heron Pkwy
- XX Colonel Maynard Rd
- 7925 Colonel Maynard Rd
- 7931 Colonel Maynard Rd
- 7903 Colonel Maynard Rd
- 7937 Colonel Maynard Rd
- 7825 Colonel Maynard Rd
- 7823 Colonel Maynard Rd
- 8003 Colonel Maynard Rd
- 7819 Colonel Maynard Rd
- 8009 Colonel Maynard Rd
- 7900 Colonel Maynard Rd
- 7824 Colonel Maynard Rd
- 8012 Colonel Maynard Rd
- 7723 Colonel Maynard Rd
- 7717 Craig Rd
- 7704 Craig Rd
- 7627 Colonel Maynard Rd
- 12274 Spectrum Rd
- 7618 Colonel Maynard Rd
- 7605 Colonel Maynard Rd
- 12251 Spectrum Rd
Your Personal Tour Guide
Ask me questions while you tour the home.