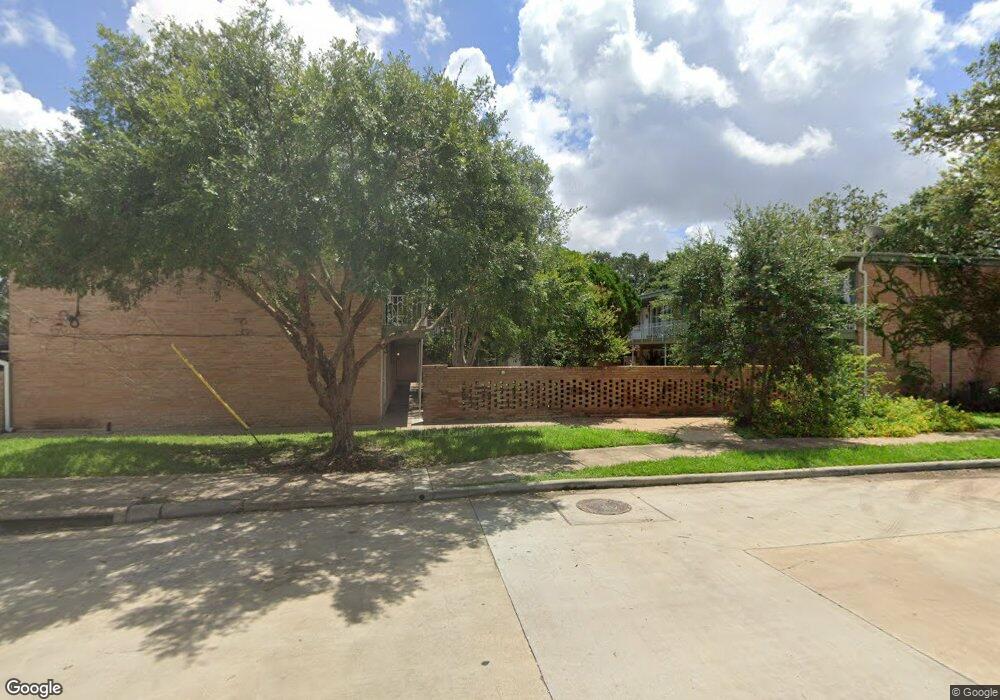
7925 Rampart St Unit 103 Houston, TX 77081
Meyerland Area NeighborhoodEstimated Value: $98,249 - $145,000
2
Beds
1
Bath
840
Sq Ft
$148/Sq Ft
Est. Value
About This Home
This home is located at 7925 Rampart St Unit 103, Houston, TX 77081 and is currently estimated at $124,562, approximately $148 per square foot. 7925 Rampart St Unit 103 is a home located in Harris County with nearby schools including Braeburn Elementary School, Long Academy, and Bellaire High School.
Ownership History
Date
Name
Owned For
Owner Type
Purchase Details
Closed on
May 11, 2021
Sold by
Fisher Michael Todd and Fisher Noemi
Bought by
Hayat Ahmed
Current Estimated Value
Purchase Details
Closed on
Aug 11, 2011
Sold by
Sepulvado Wendy L
Bought by
Fisher Michael Todd and Fisher Noemi
Purchase Details
Closed on
Jan 15, 2010
Sold by
Pruett Brian A and Pruett Brian Adam
Bought by
Sepulvado Wendy L
Home Financials for this Owner
Home Financials are based on the most recent Mortgage that was taken out on this home.
Original Mortgage
$30,000
Interest Rate
4.76%
Mortgage Type
Seller Take Back
Purchase Details
Closed on
Jun 28, 2005
Sold by
Thiel Donald
Bought by
Pruett Brian A and Pruett Brenda C
Purchase Details
Closed on
Apr 19, 1994
Sold by
Barbieri James Blair and Barbieri Jo Ann
Bought by
Wang Mary Wen Tzy
Create a Home Valuation Report for This Property
The Home Valuation Report is an in-depth analysis detailing your home's value as well as a comparison with similar homes in the area
Home Values in the Area
Average Home Value in this Area
Purchase History
| Date | Buyer | Sale Price | Title Company |
|---|---|---|---|
| Hayat Ahmed | -- | None Listed On Document | |
| Fisher Michael Todd | -- | Chicago Title | |
| Sepulvado Wendy L | -- | Chicago Title Insurance Co | |
| Pruett Brian A | -- | -- | |
| Wang Mary Wen Tzy | -- | -- |
Source: Public Records
Mortgage History
| Date | Status | Borrower | Loan Amount |
|---|---|---|---|
| Previous Owner | Sepulvado Wendy L | $30,000 |
Source: Public Records
Tax History Compared to Growth
Tax History
| Year | Tax Paid | Tax Assessment Tax Assessment Total Assessment is a certain percentage of the fair market value that is determined by local assessors to be the total taxable value of land and additions on the property. | Land | Improvement |
|---|---|---|---|---|
| 2025 | $2,182 | $100,292 | $19,055 | $81,237 |
| 2024 | $2,182 | $104,288 | $19,815 | $84,473 |
| 2023 | $2,182 | $104,288 | $19,815 | $84,473 |
| 2022 | $2,027 | $92,075 | $17,494 | $74,581 |
| 2021 | $1,603 | $68,783 | $13,069 | $55,714 |
| 2020 | $1,666 | $68,783 | $13,069 | $55,714 |
| 2019 | $2,083 | $82,309 | $15,639 | $66,670 |
| 2018 | $2,083 | $82,309 | $15,639 | $66,670 |
| 2017 | $2,081 | $82,309 | $15,639 | $66,670 |
| 2016 | $1,291 | $51,065 | $9,702 | $41,363 |
| 2015 | -- | $51,065 | $9,702 | $41,363 |
| 2014 | -- | $0 | $0 | $0 |
Source: Public Records
Map
Nearby Homes
- 5542 Holly St Unit 207
- 5542 Holly St Unit 209
- 5542 Holly St Unit 205
- 5534 Holly St Unit I
- 5614 Edith St
- 5515 Felice Dr
- 7714 Renwick Dr Unit 107
- 7714 Renwick Dr Unit 39
- 7714 Renwick Dr Unit 23
- 5651 Edith St
- 5615 Beechnut St
- 5474 Carew St
- 5411 Pine St
- 5619 Darnell St
- 5506 Darnell St
- 5615 Indigo St
- 5447 Beechnut St
- 5518 Indigo St
- 811 Woodstock St
- 5511 Indigo St
- 5538 Holly St Unit 318
- 5538 Holly St Unit 310
- 7925 Rampart St Unit 106
- 7925 Rampart St Unit 109
- 7925 Rampart St Unit 105
- 7925 Rampart St Unit 104
- 7925 Rampart St Unit 116
- 7925 Rampart St Unit 115
- 7925 Rampart St Unit 108
- 7925 Rampart St Unit 107
- 7925 Rampart St Unit 110
- 7925 Rampart St Unit 102
- 7925 Rampart St Unit 101
- 5538 Holly St Unit 314
- 5538 Holly St Unit 313
- 5538 Holly St Unit 312
- 5538 Holly St Unit 317
- 5538 Holly St Unit 316
- 5538 Holly St Unit 315
- 7925 Rampart St Unit 111