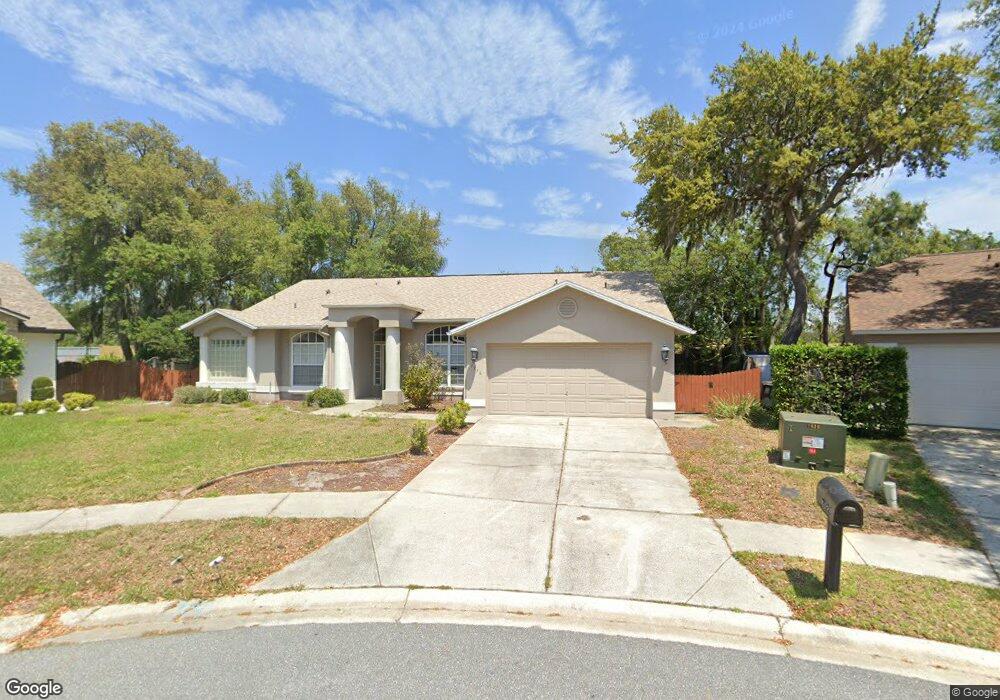
7926 Noisette Ln New Port Richey, FL 34654
River Ridge NeighborhoodEstimated Value: $414,600 - $455,000
3
Beds
3
Baths
2,660
Sq Ft
$162/Sq Ft
Est. Value
About This Home
This home is located at 7926 Noisette Ln, New Port Richey, FL 34654 and is currently estimated at $431,900, approximately $162 per square foot. 7926 Noisette Ln is a home located in Pasco County with nearby schools including River Ridge High School, Cypress Elementary School, and River Ridge Middle School.
Ownership History
Date
Name
Owned For
Owner Type
Purchase Details
Closed on
Aug 14, 2014
Sold by
Thr Florida Lp
Bought by
2014-2 Ih Borrower Lp
Current Estimated Value
Purchase Details
Closed on
Oct 9, 2012
Sold by
Steffens James D and Steffens Mary L
Bought by
Thr Florida Llc
Purchase Details
Closed on
Oct 3, 2002
Sold by
Addante Constantin and Addante Francesco
Bought by
Steffens James D and Steffens Mary L
Home Financials for this Owner
Home Financials are based on the most recent Mortgage that was taken out on this home.
Original Mortgage
$148,000
Interest Rate
6.27%
Mortgage Type
New Conventional
Purchase Details
Closed on
Jan 27, 1998
Sold by
Peek Grace M
Bought by
Addante Francesco and Addante Constantin A
Purchase Details
Closed on
Jul 31, 1995
Sold by
N G Dev Corp
Bought by
Peek Grace M
Home Financials for this Owner
Home Financials are based on the most recent Mortgage that was taken out on this home.
Original Mortgage
$106,900
Interest Rate
7.5%
Mortgage Type
Purchase Money Mortgage
Create a Home Valuation Report for This Property
The Home Valuation Report is an in-depth analysis detailing your home's value as well as a comparison with similar homes in the area
Home Values in the Area
Average Home Value in this Area
Purchase History
| Date | Buyer | Sale Price | Title Company |
|---|---|---|---|
| 2014-2 Ih Borrower Lp | -- | None Available | |
| Thr Florida Llc | $150,000 | Brokers Title Of Tampa Llc | |
| Steffens James D | $185,000 | -- | |
| Addante Francesco | $136,000 | -- | |
| Peek Grace M | $27,500 | -- |
Source: Public Records
Mortgage History
| Date | Status | Borrower | Loan Amount |
|---|---|---|---|
| Previous Owner | Addante Francesco | $148,000 | |
| Previous Owner | Peek Grace M | $106,900 |
Source: Public Records
Tax History Compared to Growth
Tax History
| Year | Tax Paid | Tax Assessment Tax Assessment Total Assessment is a certain percentage of the fair market value that is determined by local assessors to be the total taxable value of land and additions on the property. | Land | Improvement |
|---|---|---|---|---|
| 2025 | $5,730 | $353,379 | $77,993 | $275,386 |
| 2024 | $5,730 | $355,546 | $77,993 | $277,553 |
| 2023 | $5,469 | $363,351 | $71,033 | $292,318 |
| 2022 | $4,466 | $303,147 | $61,913 | $241,234 |
| 2021 | $3,934 | $239,136 | $55,554 | $183,582 |
| 2020 | $3,538 | $207,764 | $41,374 | $166,390 |
| 2019 | $3,524 | $205,146 | $41,374 | $163,772 |
| 2018 | $3,418 | $198,206 | $41,374 | $156,832 |
| 2017 | $3,190 | $180,596 | $41,374 | $139,222 |
| 2016 | $3,050 | $172,097 | $41,374 | $130,723 |
| 2015 | $2,881 | $158,618 | $41,374 | $117,244 |
| 2014 | $2,635 | $148,261 | $40,094 | $108,167 |
Source: Public Records
Map
Nearby Homes
- 12041 Penzance Ln
- 12031 Penzance Ln
- 7828 Primula Ln
- 7825 Burnet Ln
- 7940 Fashion Loop
- 7821 Floradora Dr
- 12536 Eclipse Ct
- 0 Moon Lake Rd Unit MFRW7863538
- 11742 Castine St
- 11805 Castine St
- 11839 Castine St
- 11916 Castine St
- 11901 Castine St
- 12629 Lacey Dr
- 11632 Castine St
- 8512 Reedville St
- 11520 Lounds Ct
- 11418 Tee Time Cir
- 11343 Tee Time Cir
- 11506 Dampier Ct
- 7924 Noisette Ln
- 7918 Noisette Ln
- 7919 Noisette Ln
- 7911 Noisette Ln
- 7910 Noisette Ln
- 12147 Penzance Ln
- 12065 Penzance Ln
- 12141 Penzance Ln
- 12151 Penzance Ln
- 12057 Penzance Ln
- 12122 Penzance Ln
- 12108 Penzance Ln
- 12126 Penzance Ln
- 12100 Penzance Ln
- 12152 Penzance Ln
- 12134 Penzance Ln
- 12056 Penzance Ln
- 12148 Penzance Ln
- 12043 Penzance Ln
- 12119 Roseland Dr