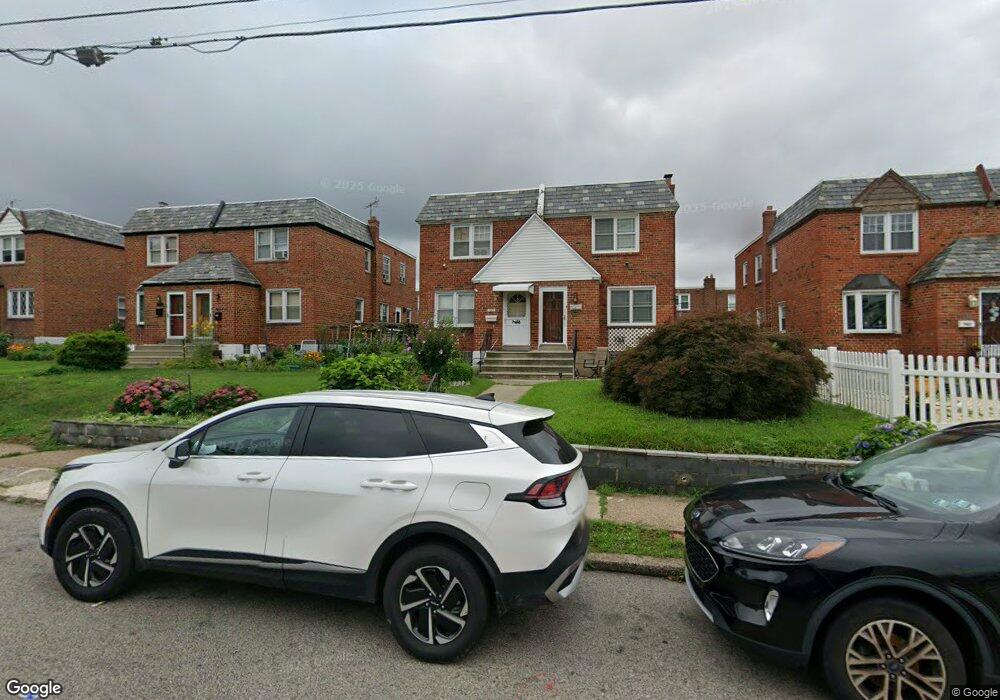
7927 Bradford St Philadelphia, PA 19152
Rhawnhurst NeighborhoodEstimated Value: $321,000 - $345,000
--
Bed
--
Bath
1,304
Sq Ft
$253/Sq Ft
Est. Value
About This Home
This home is located at 7927 Bradford St, Philadelphia, PA 19152 and is currently estimated at $330,534, approximately $253 per square foot. 7927 Bradford St is a home with nearby schools including Rhawnhurst School, Castor Gardens Middle School, and Northeast High School.
Ownership History
Date
Name
Owned For
Owner Type
Purchase Details
Closed on
Sep 8, 2017
Sold by
Derocco Martino De and Rocco Julia A De
Bought by
Huang Guo Yong and Li Xiu Lan
Current Estimated Value
Home Financials for this Owner
Home Financials are based on the most recent Mortgage that was taken out on this home.
Original Mortgage
$135,000
Outstanding Balance
$112,434
Interest Rate
3.89%
Mortgage Type
Commercial
Estimated Equity
$218,100
Purchase Details
Closed on
Oct 14, 2010
Sold by
Qiu Shi Jin and Cheng Ran Lan
Bought by
Qiu Liyan and Qiu Gang
Purchase Details
Closed on
May 1, 2003
Sold by
Justiniano Alberto and Justiniano Yolanda
Bought by
Qiu Shi Jin and Cheng Ran Lan
Home Financials for this Owner
Home Financials are based on the most recent Mortgage that was taken out on this home.
Original Mortgage
$90,000
Interest Rate
5.93%
Mortgage Type
Purchase Money Mortgage
Purchase Details
Closed on
Jun 30, 1997
Sold by
Guckin Margaret M and Haberkern Anne Marie
Bought by
Justiniano Alberto and Justiniano Yolanda
Create a Home Valuation Report for This Property
The Home Valuation Report is an in-depth analysis detailing your home's value as well as a comparison with similar homes in the area
Home Values in the Area
Average Home Value in this Area
Purchase History
| Date | Buyer | Sale Price | Title Company |
|---|---|---|---|
| Huang Guo Yong | $220,020 | Statewide Abstract Group Inc | |
| Qiu Liyan | -- | None Available | |
| Qiu Shi Jin | $130,000 | -- | |
| Justiniano Alberto | $61,000 | -- |
Source: Public Records
Mortgage History
| Date | Status | Borrower | Loan Amount |
|---|---|---|---|
| Open | Huang Guo Yong | $135,000 | |
| Previous Owner | Qiu Shi Jin | $90,000 |
Source: Public Records
Tax History Compared to Growth
Tax History
| Year | Tax Paid | Tax Assessment Tax Assessment Total Assessment is a certain percentage of the fair market value that is determined by local assessors to be the total taxable value of land and additions on the property. | Land | Improvement |
|---|---|---|---|---|
| 2026 | $3,424 | $307,700 | $61,540 | $246,160 |
| 2025 | $3,424 | $307,700 | $61,540 | $246,160 |
| 2024 | $3,424 | $307,700 | $61,540 | $246,160 |
| 2023 | $3,424 | $244,600 | $48,920 | $195,680 |
| 2022 | $2,214 | $199,600 | $48,920 | $150,680 |
| 2021 | $2,844 | $0 | $0 | $0 |
| 2020 | $2,844 | $0 | $0 | $0 |
| 2019 | $2,590 | $0 | $0 | $0 |
| 2018 | $2,373 | $0 | $0 | $0 |
| 2017 | $2,373 | $0 | $0 | $0 |
| 2016 | $1,953 | $0 | $0 | $0 |
| 2015 | $1,869 | $0 | $0 | $0 |
| 2014 | -- | $169,500 | $38,773 | $130,727 |
| 2012 | -- | $20,544 | $3,241 | $17,303 |
Source: Public Records
Map
Nearby Homes
- 2345 Ripley St
- 2301 Ripley St
- 2302 Rhawn St
- 2308 Fuller St
- 2250 Stanwood St
- 2232 Stanwood St
- 2727 Rhawn St Unit 7AB
- 2123 Loney St
- 7914 Farnsworth St
- 2321 Emerson St
- 7722 Fairfield St
- 8130 Farnsworth St
- 2223 Emerson St
- 7815 Horrocks St
- 2755 Rhawn St
- 2029 Loney St
- 2803 Rhawn St
- 8142 Lister St
- 2023 Hartel Ave
- 2120 Napfle St
- 7925 Bradford St
- 7923 Bradford St
- 7929 Bradford St
- 7931 Bradford St
- 7921 Bradford St
- 7938 Leonard St
- 7933 Bradford St
- 7919 Bradford St
- 7940 Leonard St
- 7936 Leonard St
- 7934 Leonard St
- 7942 Leonard St
- 7944 Leonard St
- 7932 Leonard St
- 7930 Leonard St
- 7935 Bradford St
- 7917 Bradford St
- 7946 Leonard St
- 7928 Leonard St
- 7948 Leonard St