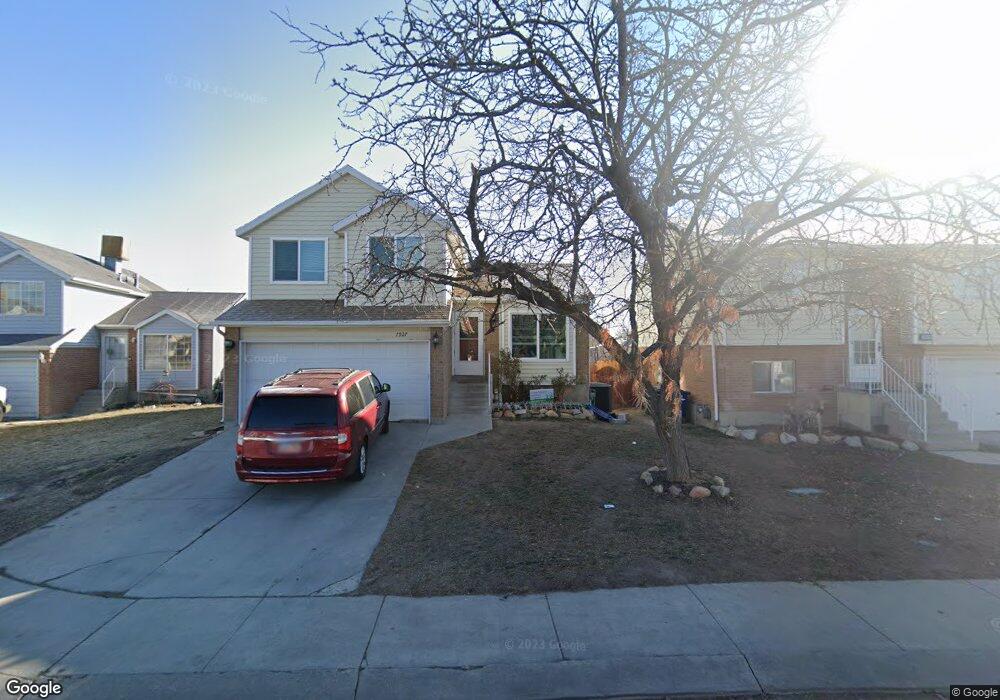
7927 Linton Dr West Jordan, UT 84088
Estimated Value: $435,000 - $453,000
3
Beds
2
Baths
1,730
Sq Ft
$255/Sq Ft
Est. Value
About This Home
This home is located at 7927 Linton Dr, West Jordan, UT 84088 and is currently estimated at $440,876, approximately $254 per square foot. 7927 Linton Dr is a home located in Salt Lake County with nearby schools including Columbia Elementary School, Joel P. Jensen Middle School, and West Jordan High School.
Ownership History
Date
Name
Owned For
Owner Type
Purchase Details
Closed on
Feb 18, 2011
Sold by
Guymon Steven and Guymon Michelle
Bought by
Perkins Spencer and Cuenca Ana
Current Estimated Value
Home Financials for this Owner
Home Financials are based on the most recent Mortgage that was taken out on this home.
Original Mortgage
$123,748
Outstanding Balance
$82,517
Interest Rate
4.25%
Mortgage Type
FHA
Estimated Equity
$358,359
Purchase Details
Closed on
Dec 1, 2005
Sold by
Hud
Bought by
Guymon Steven and Guymon Michelle
Home Financials for this Owner
Home Financials are based on the most recent Mortgage that was taken out on this home.
Original Mortgage
$112,000
Interest Rate
6.12%
Mortgage Type
Purchase Money Mortgage
Purchase Details
Closed on
Sep 28, 2005
Sold by
Mortgage Electronic Registration Systems
Bought by
Hud
Purchase Details
Closed on
Jul 19, 2005
Sold by
Hieb Bradley R and Hieb Lisa A
Bought by
Mortgage Electronic Registration Systems and Wells Fargo Bank Na
Purchase Details
Closed on
Dec 7, 2001
Sold by
Johnson Brian L and Johnson Lisa
Bought by
Hieb Bradley R and Hieb Lisa A
Home Financials for this Owner
Home Financials are based on the most recent Mortgage that was taken out on this home.
Original Mortgage
$146,205
Interest Rate
6.67%
Mortgage Type
FHA
Purchase Details
Closed on
Oct 15, 1999
Sold by
Hud
Bought by
Johnson Brian L and Johnson Lisa
Home Financials for this Owner
Home Financials are based on the most recent Mortgage that was taken out on this home.
Original Mortgage
$124,306
Interest Rate
7.25%
Mortgage Type
Construction
Purchase Details
Closed on
Apr 3, 1999
Sold by
First Nationwide Mtg Corp
Bought by
Hud
Purchase Details
Closed on
Mar 30, 1999
Sold by
Dell W C Donavan and Dell Denise L
Bought by
First Nationwide Mtg Corp
Purchase Details
Closed on
Oct 20, 1998
Sold by
Dell W C Donavan
Bought by
Dell Denise L
Purchase Details
Closed on
May 15, 1997
Sold by
Turner Gerald L
Bought by
Dell W C Donavan and Dell Denise L
Home Financials for this Owner
Home Financials are based on the most recent Mortgage that was taken out on this home.
Original Mortgage
$112,113
Interest Rate
8.15%
Mortgage Type
FHA
Create a Home Valuation Report for This Property
The Home Valuation Report is an in-depth analysis detailing your home's value as well as a comparison with similar homes in the area
Home Values in the Area
Average Home Value in this Area
Purchase History
| Date | Buyer | Sale Price | Title Company |
|---|---|---|---|
| Perkins Spencer | -- | Advanced Title Slc | |
| Guymon Steven | -- | Us Title Of Utah | |
| Hud | -- | Backman Title Services | |
| Mortgage Electronic Registration Systems | $156,197 | -- | |
| Hieb Bradley R | -- | Reliable Title | |
| Johnson Brian L | -- | Equity Title | |
| Hud | -- | Backman Stewart Title Servic | |
| First Nationwide Mtg Corp | $119,212 | Backman Stewart Title Servic | |
| Dell Denise L | -- | -- | |
| Dell W C Donavan | -- | -- |
Source: Public Records
Mortgage History
| Date | Status | Borrower | Loan Amount |
|---|---|---|---|
| Open | Perkins Spencer | $123,748 | |
| Previous Owner | Guymon Steven | $112,000 | |
| Previous Owner | Hieb Bradley R | $146,205 | |
| Previous Owner | Johnson Brian L | $124,306 | |
| Previous Owner | Dell W C Donavan | $112,113 |
Source: Public Records
Tax History Compared to Growth
Tax History
| Year | Tax Paid | Tax Assessment Tax Assessment Total Assessment is a certain percentage of the fair market value that is determined by local assessors to be the total taxable value of land and additions on the property. | Land | Improvement |
|---|---|---|---|---|
| 2025 | $2,042 | $399,900 | $86,800 | $313,100 |
| 2024 | $2,042 | $392,800 | $85,200 | $307,600 |
| 2023 | $2,089 | $378,800 | $81,900 | $296,900 |
| 2022 | $2,168 | $386,700 | $80,300 | $306,400 |
| 2021 | $1,793 | $291,200 | $57,200 | $234,000 |
| 2020 | $1,707 | $260,100 | $57,200 | $202,900 |
| 2019 | $1,696 | $253,500 | $57,200 | $196,300 |
| 2018 | $1,476 | $218,800 | $55,000 | $163,800 |
| 2017 | $1,319 | $194,600 | $55,000 | $139,600 |
| 2016 | $1,235 | $171,300 | $55,000 | $116,300 |
| 2015 | $1,160 | $156,800 | $56,000 | $100,800 |
| 2014 | $1,180 | $157,100 | $57,100 | $100,000 |
Source: Public Records
Map
Nearby Homes
- 3066 W Linton Dr
- 7987 S 2980 W
- 7942 S 2800 W
- 3165 W 7720 S
- 7721 Sunset Cir
- 7993 S 2760 W
- 7968 S 2700 W
- 3332 Lower Newark Way
- 3354 W 7800 S
- 7604 S Autumn Dr
- 2886 W 7550 S
- 8058 S Lismore Ln Unit 304
- 7642 S 2700 W
- 7611 S Springbrook Dr
- 8407 Meadow Green Way
- 3476 W Spaulding Rd
- 3112 Green Acre Dr
- 3422 Briar Dr
- 8180 S Old Bingham Hwy
- 2497 Bueno Vista Dr
- 7927 S Linton Dr
- 7931 Linton Dr
- 7923 Linton Dr
- 7935 Linton Dr
- 7935 S Linton Dr
- 7917 Linton Dr
- 7917 S Linton Dr
- 3031 Linton Dr
- 3031 W Linton Dr
- 7939 Linton Dr
- 7939 S Linton Dr
- 7915 S Linton Dr
- 7924 S 2940 W
- 7916 S 2940 W
- 7936 S Linton Dr
- 7936 Linton Dr
- 3018 W Linton Dr
- 7943 S Linton Dr
- 7943 Linton Dr
- 3018 Linton Dr