7928 S 3960 W West Jordan, UT 84088
Jordan Oaks NeighborhoodEstimated Value: $464,000 - $498,000
3
Beds
1
Bath
1,054
Sq Ft
$454/Sq Ft
Est. Value
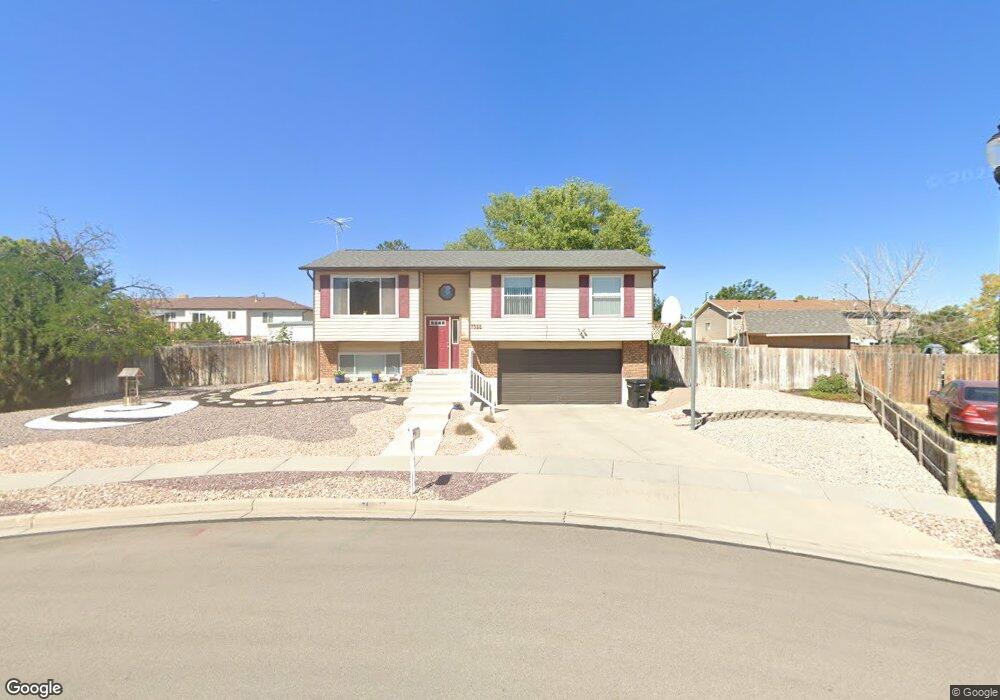
About This Home
This home is located at 7928 S 3960 W, West Jordan, UT 84088 and is currently estimated at $478,630, approximately $454 per square foot. 7928 S 3960 W is a home located in Salt Lake County with nearby schools including Columbia Elementary School, Joel P. Jensen Middle School, and West Jordan High School.
Ownership History
Date
Name
Owned For
Owner Type
Purchase Details
Closed on
Jul 22, 1997
Sold by
Clark Earl M and Clark Kim W
Bought by
Clark Earl M and Clark Kim W
Current Estimated Value
Home Financials for this Owner
Home Financials are based on the most recent Mortgage that was taken out on this home.
Original Mortgage
$88,800
Outstanding Balance
$12,951
Interest Rate
7.7%
Estimated Equity
$465,679
Purchase Details
Closed on
Jul 21, 1995
Sold by
Clark Keith D and Clark Anna E
Bought by
Clark Earl M and Clark Kim W
Home Financials for this Owner
Home Financials are based on the most recent Mortgage that was taken out on this home.
Original Mortgage
$82,400
Interest Rate
7.62%
Create a Home Valuation Report for This Property
The Home Valuation Report is an in-depth analysis detailing your home's value as well as a comparison with similar homes in the area
Home Values in the Area
Average Home Value in this Area
Purchase History
| Date | Buyer | Sale Price | Title Company |
|---|---|---|---|
| Clark Earl M | -- | -- | |
| Clark Earl M | -- | First American Title |
Source: Public Records
Mortgage History
| Date | Status | Borrower | Loan Amount |
|---|---|---|---|
| Open | Clark Earl M | $88,800 | |
| Previous Owner | Clark Earl M | $82,400 |
Source: Public Records
Tax History Compared to Growth
Tax History
| Year | Tax Paid | Tax Assessment Tax Assessment Total Assessment is a certain percentage of the fair market value that is determined by local assessors to be the total taxable value of land and additions on the property. | Land | Improvement |
|---|---|---|---|---|
| 2025 | $2,181 | $433,400 | $126,200 | $307,200 |
| 2024 | $2,181 | $419,700 | $122,000 | $297,700 |
| 2023 | $2,181 | $377,700 | $117,300 | $260,400 |
| 2022 | $2,167 | $386,500 | $115,000 | $271,500 |
| 2021 | $1,854 | $301,100 | $91,000 | $210,100 |
| 2020 | $1,640 | $249,900 | $85,000 | $164,900 |
| 2019 | $1,647 | $246,200 | $85,000 | $161,200 |
| 2018 | $1,455 | $215,600 | $80,300 | $135,300 |
| 2017 | $1,371 | $202,400 | $80,300 | $122,100 |
| 2016 | $1,395 | $193,400 | $76,300 | $117,100 |
| 2015 | $1,384 | $187,100 | $77,800 | $109,300 |
| 2014 | $1,325 | $176,400 | $74,100 | $102,300 |
Source: Public Records
Map
Nearby Homes
- 3977 W Elwood Way
- 7989 S 3725 W
- 7991 S 3725 W
- 3647 W 7865 S
- 3629 W 7825 S
- 3546 W 7980 S
- 3476 W Spaulding Rd
- 8400 S 4000 W Unit 134
- 8180 S Old Bingham Hwy
- 8461 S Meadowlark Ln
- 8058 S Lismore Ln Unit 304
- 3422 Briar Dr
- 7973 S Nebo Dr
- 3332 Lower Newark Way
- 3354 W 7800 S
- 4678 Emmons Dr
- 7611 S Springbrook Dr
- 3888 W 8700 S
- 8359 Etude Dr
- 3931 W Dansere Cir