Estimated Value: $687,000 - $729,000
5
Beds
4
Baths
2,718
Sq Ft
$259/Sq Ft
Est. Value
About This Home
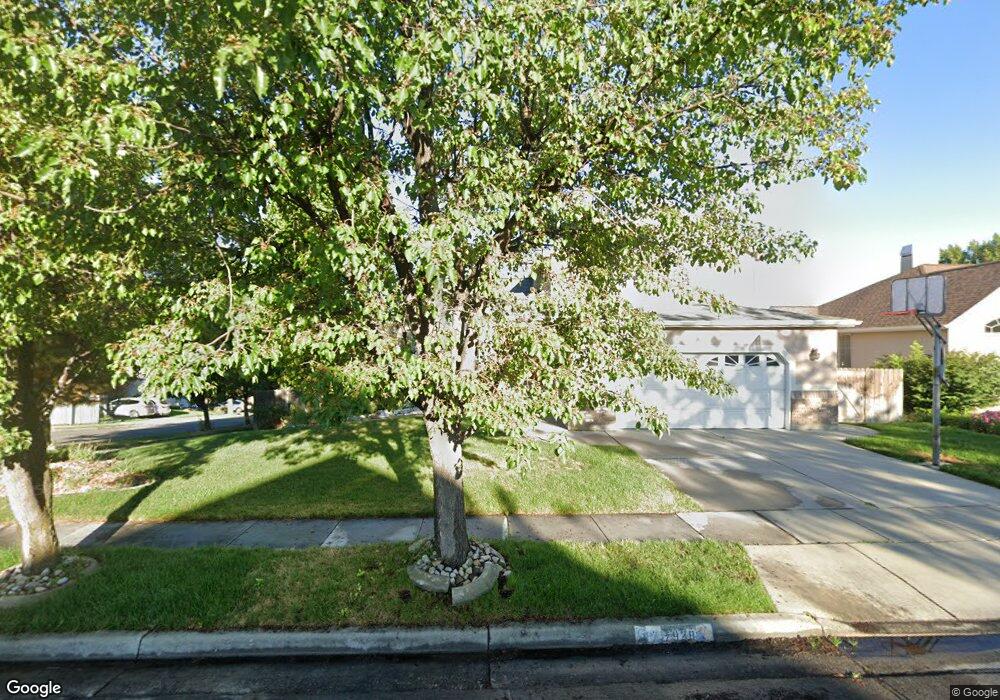
This home is located at 7928 Twelve Pines Dr, Sandy, UT 84094 and is currently estimated at $703,646, approximately $258 per square foot. 7928 Twelve Pines Dr is a home located in Salt Lake County with nearby schools including Peruvian Park Elementary School, Union Middle School, and Hillcrest High School.
Ownership History
Date
Name
Owned For
Owner Type
Purchase Details
Closed on
Oct 18, 2022
Sold by
Foster Susan
Bought by
Susan Page Trust
Current Estimated Value
Purchase Details
Closed on
Apr 27, 2020
Sold by
Foster Susan M and Foster Phillip S
Bought by
Foster Susan
Home Financials for this Owner
Home Financials are based on the most recent Mortgage that was taken out on this home.
Original Mortgage
$161,500
Interest Rate
3.6%
Mortgage Type
New Conventional
Purchase Details
Closed on
Jun 7, 2013
Sold by
Page Susan
Bought by
Foster Susan M and Foster Phillip S
Home Financials for this Owner
Home Financials are based on the most recent Mortgage that was taken out on this home.
Original Mortgage
$177,900
Interest Rate
3.32%
Mortgage Type
New Conventional
Purchase Details
Closed on
Jun 6, 2013
Sold by
Page Gregory A
Bought by
Foster Susan M and Page Susan
Home Financials for this Owner
Home Financials are based on the most recent Mortgage that was taken out on this home.
Original Mortgage
$177,900
Interest Rate
3.32%
Mortgage Type
New Conventional
Purchase Details
Closed on
Mar 26, 2007
Sold by
Page Susan M
Bought by
Page Susan
Home Financials for this Owner
Home Financials are based on the most recent Mortgage that was taken out on this home.
Original Mortgage
$100,000
Interest Rate
6.31%
Mortgage Type
New Conventional
Purchase Details
Closed on
Mar 20, 2007
Sold by
Page Susan
Bought by
Page Susan M
Home Financials for this Owner
Home Financials are based on the most recent Mortgage that was taken out on this home.
Original Mortgage
$100,000
Interest Rate
6.31%
Mortgage Type
New Conventional
Purchase Details
Closed on
Sep 8, 2006
Sold by
Page Susy
Bought by
Page Susan
Purchase Details
Closed on
Jul 20, 2006
Sold by
Page Gregory A
Bought by
Page Susy
Purchase Details
Closed on
Oct 13, 2004
Sold by
Page Susan
Bought by
Page Gregory
Purchase Details
Closed on
Oct 25, 2001
Sold by
Flowers Joel T and Flowers Jennifer S
Bought by
Page Gregory and Page Susan
Home Financials for this Owner
Home Financials are based on the most recent Mortgage that was taken out on this home.
Original Mortgage
$207,900
Interest Rate
6.87%
Purchase Details
Closed on
Aug 21, 1997
Sold by
Swapp James C and Swapp Susan M
Bought by
Flowers Joel T and Flowers Jennifer S
Home Financials for this Owner
Home Financials are based on the most recent Mortgage that was taken out on this home.
Original Mortgage
$178,400
Interest Rate
7.45%
Purchase Details
Closed on
Oct 17, 1996
Sold by
Swapp James Craig and Swapp Susan M
Bought by
Swapp James C and Swapp Susan M
Home Financials for this Owner
Home Financials are based on the most recent Mortgage that was taken out on this home.
Original Mortgage
$172,100
Interest Rate
8.37%
Create a Home Valuation Report for This Property
The Home Valuation Report is an in-depth analysis detailing your home's value as well as a comparison with similar homes in the area
Home Values in the Area
Average Home Value in this Area
Purchase History
We collect this data history from publicly available records. To have your information removed, we recommend requesting removal directly through your county’s website.
| Date | Buyer | Sale Price | Title Company |
|---|---|---|---|
| Susan Page Trust | -- | -- | |
| Foster Susan | -- | Real Advantage Ttl Ins Agcy | |
| Foster Susan M | -- | First American Title | |
| Foster Susan M | -- | First American Title | |
| Page Susan | -- | Wasatch Title Ins Agency Llc | |
| Page Susan M | -- | Wasatch Title Ins Agency Llc | |
| Page Susan | -- | None Available | |
| Page Susy | -- | Accommodation | |
| Page Gregory | -- | Equity Title | |
| Page Gregory | -- | Superior Title Company | |
| Flowers Joel T | -- | First American Title | |
| Swapp James C | -- | -- |
Source: Public Records
Mortgage History
We collect this data history from publicly available records. To have your information removed, we recommend requesting removal directly through your county’s website.
| Date | Status | Borrower | Loan Amount |
|---|---|---|---|
| Previous Owner | Foster Susan | $161,500 | |
| Previous Owner | Foster Susan M | $177,900 | |
| Previous Owner | Page Susan M | $100,000 | |
| Previous Owner | Page Gregory | $207,900 | |
| Previous Owner | Flowers Joel T | $178,400 | |
| Previous Owner | Swapp James C | $172,100 |
Source: Public Records
Tax History
| Year | Tax Paid | Tax Assessment Tax Assessment Total Assessment is a certain percentage of the fair market value that is determined by local assessors to be the total taxable value of land and additions on the property. | Land | Improvement |
|---|---|---|---|---|
| 2025 | $3,477 | $668,000 | $236,400 | $431,600 |
| 2024 | $3,477 | $642,200 | $227,600 | $414,600 |
| 2023 | $3,477 | $570,000 | $218,800 | $351,200 |
| 2022 | $3,224 | $580,700 | $214,500 | $366,200 |
| 2021 | $2,901 | $444,000 | $187,200 | $256,800 |
| 2020 | $2,865 | $413,700 | $162,900 | $250,800 |
| 2019 | $2,840 | $399,500 | $153,700 | $245,800 |
| 2018 | $2,653 | $389,100 | $153,700 | $235,400 |
| 2017 | $2,463 | $344,800 | $153,700 | $191,100 |
| 2016 | $2,378 | $321,800 | $138,500 | $183,300 |
| 2015 | $2,487 | $312,100 | $176,800 | $135,300 |
| 2014 | $2,368 | $291,800 | $168,600 | $123,200 |
Source: Public Records
Map
Nearby Homes
- 7909 S Twelve Pines Dr
- 7910 Pear Tree Cir
- 7975 S Showcase Ln
- 1206 E Moss Cir
- 7755 S 1130 E
- 8101 S Cottonwood Hills Cir
- 8109 S Cottonwood Hills Cir
- 7795 S 1000 E
- 7714 S 1040 E
- 1341 E Creek Rd
- 8234 S Grambling Way
- 7670 S 1000 E
- 901 E 7800 S
- 867 E 7905 S
- 1079 E 8320 S
- 8373 S 1100 E Unit 39
- 798 E Spruce Tree Ln
- 7824 S Sequoia Tree Ln
- 7693 S Chad St
- 1335 E Milne Ln
- 7916 Twelve Pines Dr
- 1169 Pear Tree Dr
- 7954 Twelve Pines Dr
- 7917 Pear Tree Cir
- 7954 12 Pines Dr
- 7908 Twelve Pines Dr
- 7908 S Twelve Pines Dr
- 7927 S Twelve Pines Dr
- 1170 Pear Tree Dr
- 7927 12 Pines Dr
- 7931 Pear Tree Cir
- 7931 S Pear Tree Cir
- 7927 Twelve Pines Dr
- 7943 Twelve Pines Dr
- 7943 S Twelve Pines Dr
- 7907 Pear Tree Cir
- 7962 12 Pines Dr
- 7898 Twelve Pines Dr
- 7898 S Twelve Pines Dr
- 1162 Pear Tree Dr
Your Personal Tour Guide
Ask me questions while you tour the home.