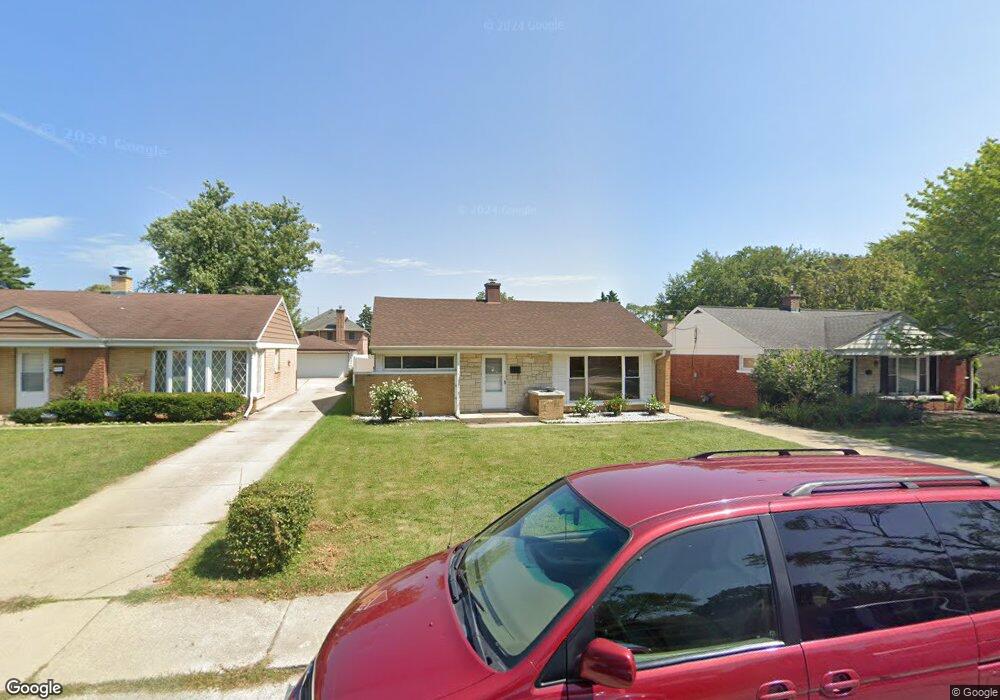
7929 N Nora Ave Niles, IL 60714
Lawrencewood Gardens NeighborhoodEstimated Value: $349,000 - $413,000
3
Beds
1
Bath
975
Sq Ft
$393/Sq Ft
Est. Value
About This Home
This home is located at 7929 N Nora Ave, Niles, IL 60714 and is currently estimated at $383,590, approximately $393 per square foot. 7929 N Nora Ave is a home located in Cook County with nearby schools including Clarence E Culver School, Niles West High School, and St John Brebeuf School.
Ownership History
Date
Name
Owned For
Owner Type
Purchase Details
Closed on
Jan 8, 2016
Sold by
Maksimovic Stamena
Bought by
Maksimovic Milomir and Maksimovic Marta B
Current Estimated Value
Purchase Details
Closed on
Apr 17, 2009
Sold by
Maksimovic Stamena and Maksimovic Milomir
Bought by
Maksimovic Stamena
Purchase Details
Closed on
Sep 5, 2007
Sold by
Maksimovic Stamena
Bought by
Maksimovic Stamena and Maksimovic Milomir
Purchase Details
Closed on
Dec 10, 2003
Sold by
Maksimovic Milomar
Bought by
Maksimovic Stamena
Home Financials for this Owner
Home Financials are based on the most recent Mortgage that was taken out on this home.
Original Mortgage
$192,000
Outstanding Balance
$82,655
Interest Rate
4.87%
Mortgage Type
Unknown
Estimated Equity
$300,935
Purchase Details
Closed on
Nov 28, 2001
Sold by
Schutten Madeline
Bought by
Maksimovic Milomir
Home Financials for this Owner
Home Financials are based on the most recent Mortgage that was taken out on this home.
Original Mortgage
$150,000
Interest Rate
6.68%
Create a Home Valuation Report for This Property
The Home Valuation Report is an in-depth analysis detailing your home's value as well as a comparison with similar homes in the area
Home Values in the Area
Average Home Value in this Area
Purchase History
| Date | Buyer | Sale Price | Title Company |
|---|---|---|---|
| Maksimovic Milomir | -- | North American Title Company | |
| Maksimovic Stamena | -- | None Available | |
| Maksimovic Stamena | -- | None Available | |
| Maksimovic Stamena | $240,000 | Pntn | |
| Maksimovic Milomir | $222,000 | Commonwealth Land Title Ins |
Source: Public Records
Mortgage History
| Date | Status | Borrower | Loan Amount |
|---|---|---|---|
| Open | Maksimovic Stamena | $192,000 | |
| Closed | Maksimovic Milomir | $150,000 |
Source: Public Records
Tax History Compared to Growth
Tax History
| Year | Tax Paid | Tax Assessment Tax Assessment Total Assessment is a certain percentage of the fair market value that is determined by local assessors to be the total taxable value of land and additions on the property. | Land | Improvement |
|---|---|---|---|---|
| 2024 | $6,969 | $30,001 | $9,383 | $20,618 |
| 2023 | $6,533 | $30,001 | $9,383 | $20,618 |
| 2022 | $6,533 | $30,001 | $9,383 | $20,618 |
| 2021 | $5,334 | $21,524 | $6,602 | $14,922 |
| 2020 | $5,054 | $21,524 | $6,602 | $14,922 |
| 2019 | $5,056 | $23,916 | $6,602 | $17,314 |
| 2018 | $4,467 | $19,149 | $5,733 | $13,416 |
| 2017 | $4,570 | $19,149 | $5,733 | $13,416 |
| 2016 | $4,314 | $19,149 | $5,733 | $13,416 |
| 2015 | $4,418 | $18,420 | $4,865 | $13,555 |
| 2014 | $4,279 | $18,420 | $4,865 | $13,555 |
| 2013 | $4,214 | $18,420 | $4,865 | $13,555 |
Source: Public Records
Map
Nearby Homes
- 6914 W Oakton Ct
- 6964 W Cleveland St
- 8206 N Octavia Ave
- 7753 N Nordica Ave
- 7554 N Waukegan Rd
- 8258 N Octavia Ave
- 7448 W Jonquil Terrace
- 8239 N New England Ave
- 7531 W Cleveland St
- 8037 N Oriole Ave
- 7450 N Waukegan Rd Unit 206
- 8311 N Olcott Ave
- 8341 N Osceola Ave
- 7421 N Oconto Ave
- 6600 W Wood River Dr Unit B201B
- 7875 N Caldwell Ave Unit 302
- 7020 W Wright Terrace
- 108 E Edgemont Ln
- 130 E Lahon St
- 8152 N Ozark Ave
- 7923 N Nora Ave
- 7933 N Nora Ave
- 7939 N Nora Ave
- 7919 N Nora Ave
- 7943 N Nora Ave
- 7913 N Nora Ave
- 7932 N Neva Ave
- 7918 N Neva Ave
- 7938 N Neva Ave
- 7912 N Neva Ave
- 7909 N Nora Ave
- 7949 N Nora Ave
- 7928 N Nora Ave
- 7932 N Nora Ave
- 7942 N Neva Ave
- 7922 N Nora Ave
- 7953 N Nora Ave
- 7942 N Nora Ave
- 7903 N Nora Ave