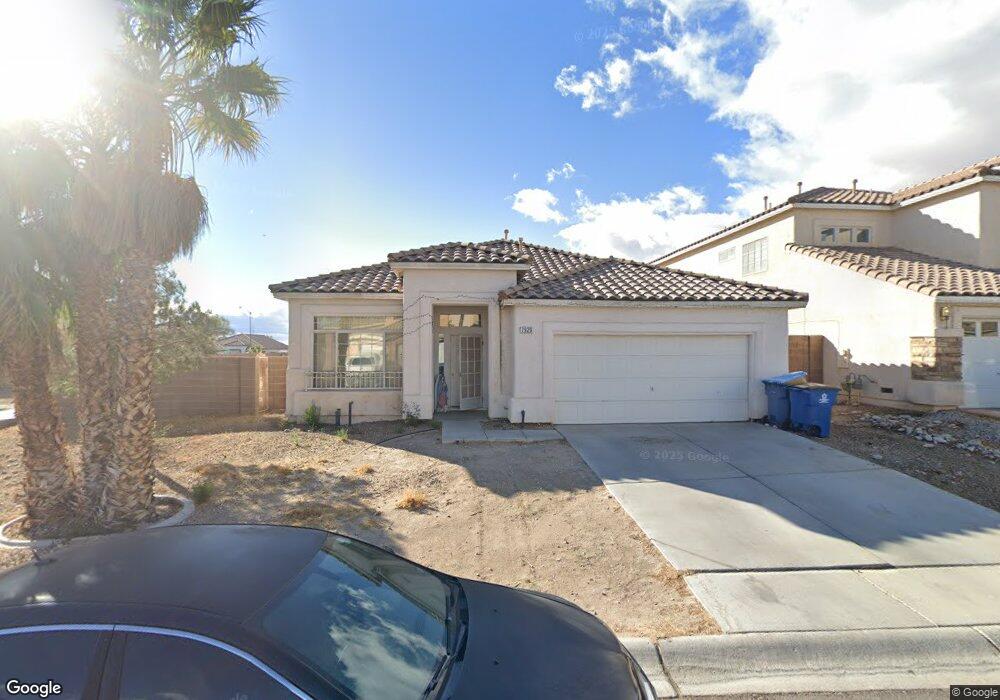
7929 Timber Horn Ct Las Vegas, NV 89147
Estimated Value: $487,627 - $501,000
3
Beds
2
Baths
1,846
Sq Ft
$267/Sq Ft
Est. Value
About This Home
This home is located at 7929 Timber Horn Ct, Las Vegas, NV 89147 and is currently estimated at $492,657, approximately $266 per square foot. 7929 Timber Horn Ct is a home located in Clark County with nearby schools including Roger M Bryan Elementary School, Clifford J Lawrence Junior High School, and Spring Valley High School.
Ownership History
Date
Name
Owned For
Owner Type
Purchase Details
Closed on
Jul 22, 2025
Sold by
Kenneth Pak and Wong Susan
Bought by
Shemy Pak Revocable Living Trust and Pak
Current Estimated Value
Purchase Details
Closed on
Nov 21, 1996
Sold by
Paks Enterprises Ltd
Bought by
Pak Ken and Wong Susan
Home Financials for this Owner
Home Financials are based on the most recent Mortgage that was taken out on this home.
Original Mortgage
$90,000
Interest Rate
7.46%
Mortgage Type
Purchase Money Mortgage
Purchase Details
Closed on
Dec 11, 1995
Sold by
Pak Ken
Bought by
Paks Enterprises Ltd
Purchase Details
Closed on
Nov 20, 1995
Sold by
Pak Ken and Wong Susan
Bought by
Pak Ken
Purchase Details
Closed on
May 11, 1995
Sold by
Bilt Perma
Bought by
Pak Ken and Wong Susan
Create a Home Valuation Report for This Property
The Home Valuation Report is an in-depth analysis detailing your home's value as well as a comparison with similar homes in the area
Home Values in the Area
Average Home Value in this Area
Purchase History
| Date | Buyer | Sale Price | Title Company |
|---|---|---|---|
| Shemy Pak Revocable Living Trust | -- | None Listed On Document | |
| Pak Ken | $141,000 | National Title Company | |
| Paks Enterprises Ltd | -- | -- | |
| Pak Ken | -- | -- | |
| Pak Ken | $133,000 | Land Title |
Source: Public Records
Mortgage History
| Date | Status | Borrower | Loan Amount |
|---|---|---|---|
| Previous Owner | Pak Ken | $90,000 |
Source: Public Records
Tax History Compared to Growth
Tax History
| Year | Tax Paid | Tax Assessment Tax Assessment Total Assessment is a certain percentage of the fair market value that is determined by local assessors to be the total taxable value of land and additions on the property. | Land | Improvement |
|---|---|---|---|---|
| 2025 | $2,458 | $100,403 | $38,850 | $61,553 |
| 2024 | $2,276 | $100,403 | $38,850 | $61,553 |
| 2023 | $2,276 | $91,912 | $33,250 | $58,662 |
| 2022 | $2,108 | $84,235 | $30,450 | $53,785 |
| 2021 | $1,952 | $76,539 | $25,200 | $51,339 |
| 2020 | $1,810 | $76,295 | $25,200 | $51,095 |
| 2019 | $1,696 | $72,185 | $21,700 | $50,485 |
| 2018 | $1,618 | $66,790 | $18,200 | $48,590 |
| 2017 | $1,960 | $66,818 | $17,500 | $49,318 |
| 2016 | $1,515 | $62,179 | $12,600 | $49,579 |
| 2015 | $1,512 | $60,596 | $11,550 | $49,046 |
| 2014 | $1,465 | $48,457 | $8,400 | $40,057 |
Source: Public Records
Map
Nearby Homes
- 8061 Petunia Flower Way
- 7938 Angel Tree Ct
- 7950 W Flamingo Rd Unit 2179
- 7950 W Flamingo Rd Unit 1085
- 7950 W Flamingo Rd Unit 1041
- 7950 W Flamingo Rd Unit 1069
- 7950 W Flamingo Rd Unit 1039
- 7950 W Flamingo Rd Unit 1169
- 7950 W Flamingo Rd Unit 1077
- 7950 W Flamingo Rd Unit 2019
- 3749 Climbing Rose St
- 8122 W Flamingo Rd Unit 251
- 8122 W Flamingo Rd Unit 146
- 8122 W Flamingo Rd Unit 226
- 8122 W Flamingo Rd Unit 148
- 3673 Spring Day Ct
- 8003 Retriever Ave
- 3685 Springbud Dr
- 3722 Violet Rose Ct
- 7885 W Flamingo Rd Unit 2012
- 7939 Timber Horn Ct
- 7939 Timber Horn Ct Unit 1
- 7928 Nookfield Dr
- 7949 Timber Horn Ct
- 7936 Nookfield Dr
- 7944 Nookfield Dr
- 3858 Falcon Springs Dr
- 3852 Falcon Springs Dr
- 7928 Timber Horn Ct
- 7936 Timber Horn Ct
- 7955 Timber Horn Ct
- 7944 Timber Horn Ct
- 3846 Falcon Springs Dr
- 7952 Nookfield Dr
- 3874 Falcon Springs Dr Unit 3
- 7952 Timber Horn Ct
- 3840 Falcon Springs Dr
- 7961 Timber Horn Ct
- 7899 Sea Horn Ct Unit n/a