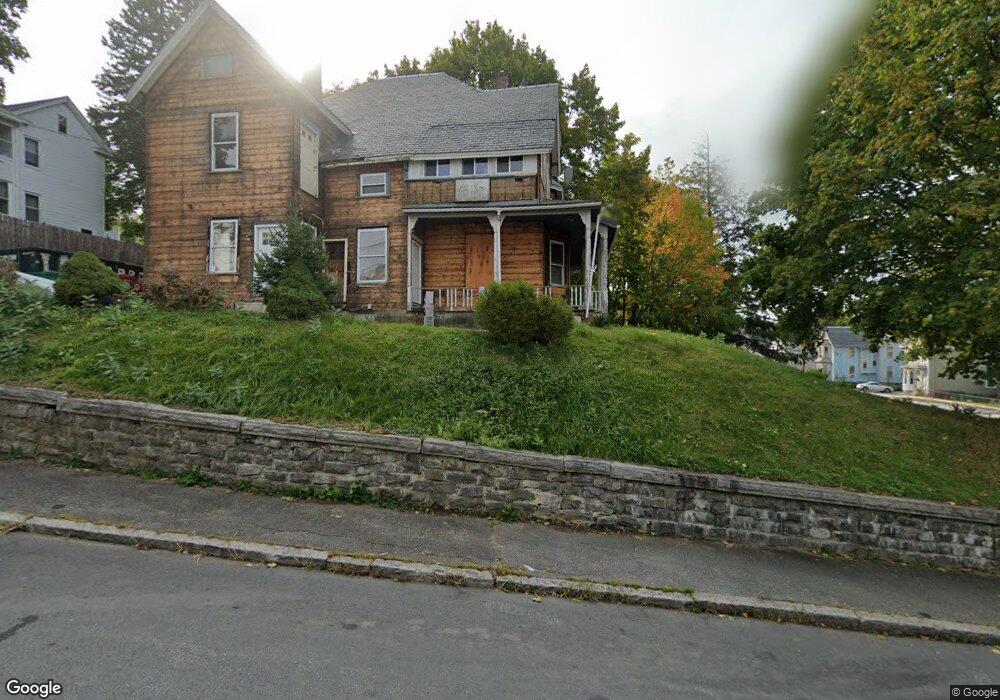
793 -795 Bridge St Lowell, MA 01850
Centralville NeighborhoodEstimated Value: $781,701 - $835,000
7
Beds
3
Baths
3,689
Sq Ft
$222/Sq Ft
Est. Value
About This Home
This home is located at 793 -795 Bridge St, Lowell, MA 01850 and is currently estimated at $818,925, approximately $221 per square foot. 793 -795 Bridge St is a home located in Middlesex County with nearby schools including S. Christa McAuliffe Elementary School, Greenhalge Elementary School, and Moody Elementary School.
Ownership History
Date
Name
Owned For
Owner Type
Purchase Details
Closed on
Oct 31, 2023
Sold by
Asante Philomena
Bought by
Abreau Aneidy and Tejada Odalis
Current Estimated Value
Home Financials for this Owner
Home Financials are based on the most recent Mortgage that was taken out on this home.
Original Mortgage
$575,000
Outstanding Balance
$560,643
Interest Rate
7.18%
Mortgage Type
Purchase Money Mortgage
Estimated Equity
$258,282
Purchase Details
Closed on
Feb 23, 2021
Sold by
Harvest Realty Vent Llc
Bought by
Asante Philomena
Home Financials for this Owner
Home Financials are based on the most recent Mortgage that was taken out on this home.
Original Mortgage
$504,000
Interest Rate
2.7%
Mortgage Type
Purchase Money Mortgage
Purchase Details
Closed on
Sep 11, 2015
Sold by
Kisob Wilfred and Kisob Emmy
Bought by
Akoh Charles
Home Financials for this Owner
Home Financials are based on the most recent Mortgage that was taken out on this home.
Original Mortgage
$116,000
Interest Rate
4.01%
Mortgage Type
New Conventional
Purchase Details
Closed on
Jan 25, 2002
Sold by
Ortega Yoselin
Bought by
Kisob Wilfred and Kisob Emmy
Home Financials for this Owner
Home Financials are based on the most recent Mortgage that was taken out on this home.
Original Mortgage
$217,800
Interest Rate
7.08%
Mortgage Type
Purchase Money Mortgage
Purchase Details
Closed on
Nov 20, 2000
Sold by
Vega Marcelino and Vega Adelaida
Bought by
Ortega Yoselin and Ortega Gumercindo
Purchase Details
Closed on
Apr 30, 1996
Sold by
Baltic Realty Corp
Bought by
Vega Marcelino and Vega Adelaida
Create a Home Valuation Report for This Property
The Home Valuation Report is an in-depth analysis detailing your home's value as well as a comparison with similar homes in the area
Home Values in the Area
Average Home Value in this Area
Purchase History
We collect this data history from publicly available records. To have your information removed, we recommend requesting removal directly through your county’s website.
| Date | Buyer | Sale Price | Title Company |
|---|---|---|---|
| Abreau Aneidy | $750,000 | None Available | |
| Asante Philomena | $630,000 | None Available | |
| Akoh Charles | $145,000 | -- | |
| Kisob Wilfred | $242,000 | -- | |
| Kisob Wilfred | $242,000 | -- | |
| Ortega Yoselin | $198,500 | -- | |
| Vega Marcelino | $40,000 | -- | |
| Vega Marcelino | $40,000 | -- |
Source: Public Records
Mortgage History
We collect this data history from publicly available records. To have your information removed, we recommend requesting removal directly through your county’s website.
| Date | Status | Borrower | Loan Amount |
|---|---|---|---|
| Open | Abreau Aneidy | $575,000 | |
| Previous Owner | Asante Philomena | $504,000 | |
| Previous Owner | Akoh Charles | $116,000 | |
| Previous Owner | Vega Marcelino | $217,800 |
Source: Public Records
Tax History
| Year | Tax Paid | Tax Assessment Tax Assessment Total Assessment is a certain percentage of the fair market value that is determined by local assessors to be the total taxable value of land and additions on the property. | Land | Improvement |
|---|---|---|---|---|
| 2025 | $9,244 | $805,200 | $171,000 | $634,200 |
| 2024 | $8,581 | $720,500 | $159,800 | $560,700 |
| 2023 | $7,987 | $643,100 | $138,900 | $504,200 |
| 2022 | $7,392 | $582,500 | $126,300 | $456,200 |
| 2021 | $6,859 | $509,600 | $109,900 | $399,700 |
| 2020 | $5,212 | $390,100 | $96,000 | $294,100 |
| 2019 | $4,694 | $334,300 | $88,900 | $245,400 |
| 2018 | $4,389 | $305,000 | $84,600 | $220,400 |
| 2017 | $4,155 | $278,500 | $76,900 | $201,600 |
| 2016 | $4,659 | $307,300 | $75,000 | $232,300 |
| 2015 | $4,310 | $278,400 | $75,000 | $203,400 |
| 2013 | $3,940 | $262,500 | $87,700 | $174,800 |
Source: Public Records
Map
Nearby Homes
- 43 12th St
- 54 Hampshire St
- 337 Beacon St
- 63-65 Sixth St
- 45 W 4th St
- 96 Fremont St
- 192 Hildreth St
- 15 4th St
- 23 18th St
- 120 Lakeview Ave
- 69 Lilley Ave
- 1 19th St Unit 3
- 18 Sutherland St
- 516 Lakeview Ave
- Lot 11 Christian St
- Lot 12 Christian St
- Lot 9 Christian St
- Lot 10 Christian St
- 11 Lilley Ave
- 51 Willard St
- 793 Bridge St
- 795 Bridge St Unit 1st Flr
- 795 Bridge St Unit 1st Floor
- 793 Bridge St Unit 1
- 795 Bridge St
- 15 12th St
- 775 Bridge St
- 10 12th St
- 25 12th St
- 821 Bridge St
- 821 Bridge St Unit 3
- 821 Bridge St
- 821 Bridge St Unit 1
- 22 12th St
- 12 12th St
- 806 Bridge St
- 829 Bridge St
- 9 11th St
- 26 11th St
- 757 Bridge St
Your Personal Tour Guide
Ask me questions while you tour the home.