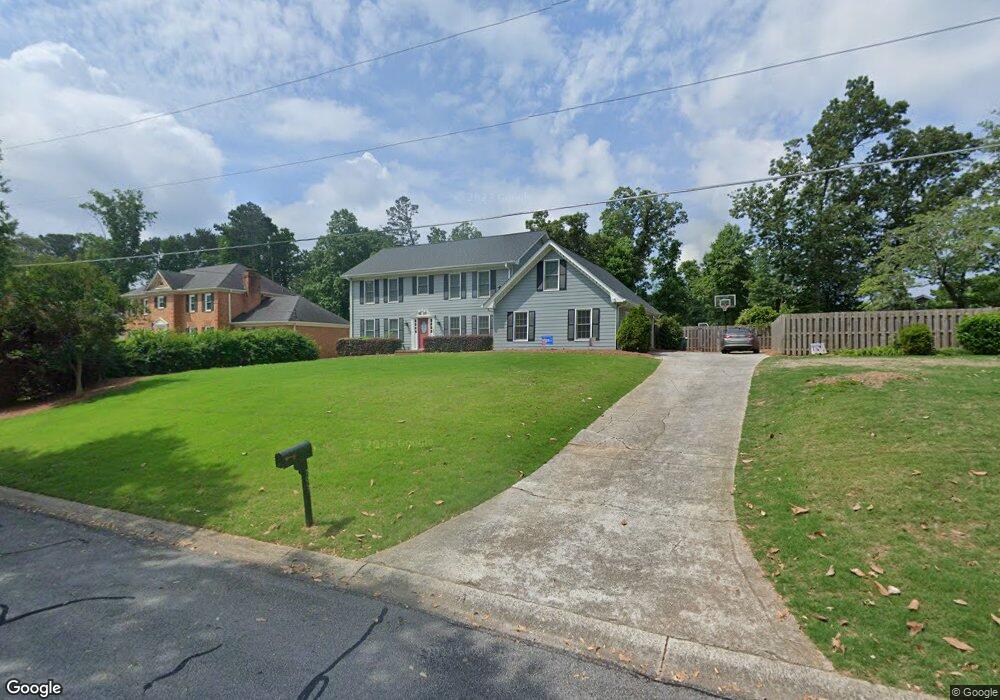
793 Angevine Ct SW Unit 4 Lilburn, GA 30047
Estimated Value: $409,474 - $490,000
4
Beds
3
Baths
2,395
Sq Ft
$194/Sq Ft
Est. Value
About This Home
This home is located at 793 Angevine Ct SW Unit 4, Lilburn, GA 30047 and is currently estimated at $464,369, approximately $193 per square foot. 793 Angevine Ct SW Unit 4 is a home located in Gwinnett County with nearby schools including Camp Creek Elementary School, Trickum Middle School, and Parkview High School.
Ownership History
Date
Name
Owned For
Owner Type
Purchase Details
Closed on
Aug 28, 2013
Sold by
Hunt Heath
Bought by
Tomlich Michael and Tomlich Karen
Current Estimated Value
Home Financials for this Owner
Home Financials are based on the most recent Mortgage that was taken out on this home.
Original Mortgage
$204,250
Outstanding Balance
$151,306
Interest Rate
4.37%
Mortgage Type
New Conventional
Estimated Equity
$313,063
Purchase Details
Closed on
May 1, 2008
Sold by
Claiborne H Thomas and Claiborne Janie M
Bought by
Hunt Heath
Home Financials for this Owner
Home Financials are based on the most recent Mortgage that was taken out on this home.
Original Mortgage
$224,730
Interest Rate
5.84%
Mortgage Type
VA
Purchase Details
Closed on
Apr 30, 1993
Sold by
Delaney Michael E
Bought by
Claiborne Janie M
Home Financials for this Owner
Home Financials are based on the most recent Mortgage that was taken out on this home.
Original Mortgage
$130,500
Interest Rate
7.57%
Create a Home Valuation Report for This Property
The Home Valuation Report is an in-depth analysis detailing your home's value as well as a comparison with similar homes in the area
Home Values in the Area
Average Home Value in this Area
Purchase History
| Date | Buyer | Sale Price | Title Company |
|---|---|---|---|
| Tomlich Michael | $215,000 | -- | |
| Hunt Heath | $220,000 | -- | |
| Claiborne Janie M | $145,000 | -- |
Source: Public Records
Mortgage History
| Date | Status | Borrower | Loan Amount |
|---|---|---|---|
| Open | Tomlich Michael | $204,250 | |
| Previous Owner | Hunt Heath | $224,730 | |
| Previous Owner | Claiborne Janie M | $130,500 |
Source: Public Records
Tax History Compared to Growth
Tax History
| Year | Tax Paid | Tax Assessment Tax Assessment Total Assessment is a certain percentage of the fair market value that is determined by local assessors to be the total taxable value of land and additions on the property. | Land | Improvement |
|---|---|---|---|---|
| 2025 | $4,610 | $170,160 | $26,120 | $144,040 |
| 2024 | $4,214 | $144,360 | $26,120 | $118,240 |
| 2023 | $4,214 | $165,320 | $36,560 | $128,760 |
| 2022 | $4,185 | $144,920 | $30,800 | $114,120 |
| 2021 | $3,550 | $111,600 | $26,000 | $85,600 |
| 2020 | $3,422 | $104,480 | $22,000 | $82,480 |
| 2019 | $3,216 | $99,120 | $22,000 | $77,120 |
| 2018 | $3,118 | $94,440 | $16,400 | $78,040 |
| 2016 | $2,764 | $77,160 | $12,000 | $65,160 |
| 2015 | $2,616 | $69,280 | $8,000 | $61,280 |
| 2014 | -- | $69,280 | $8,000 | $61,280 |
Source: Public Records
Map
Nearby Homes
- 4367 Cedar Wood Dr SW
- 4582 Warrior Trail SW
- 4307 Cedar Wood Dr SW
- 1017 Rolling Forest Ln
- 4254 Cedar Creek Trail SW Unit 8
- 4406 Hale Dr SW
- 4567 Town Crier Rd SW
- 676 Killian Hill Rd SW
- 4245 Cedar Creek Trail SW
- 4271 Weston Dr SW
- 4702 Sequoia Dr SW
- 871 Cedar Trace SW
- 4704 Arrowhead Trail SW
- 1296 Mandalay Ct SW
- 551 Killian Hill Rd SW
- 4449 Amberleaf Walk
- 793 Angevine Ct SW
- 803 Angevine Ct SW
- 803 Angevine Ct SW Unit 7
- 4466 Cedar Wood Dr SW
- 4476 Cedar Wood Dr SW
- 813 Angevine Ct SW Unit 4
- 816 Glen Ridge Dr SW Unit 7
- 792 Angevine Ct SW
- 826 Glen Ridge Dr SW Unit 7
- 802 Angevine Ct SW
- 4486 Cedar Wood Dr SW Unit 3
- 4436 Cedar Wood Dr SW
- 823 Angevine Ct SW Unit 4
- 0 Windsong Ct SW Unit 8028752
- 0 Windsong Ct SW
- 4457 Cedar Wood Dr SW
- 4467 Cedar Wood Dr SW Unit 3
- 836 Glen Ridge Dr SW
- 0 Glen Ridge Dr SW Unit 7030542
- 0 Glen Ridge Dr SW