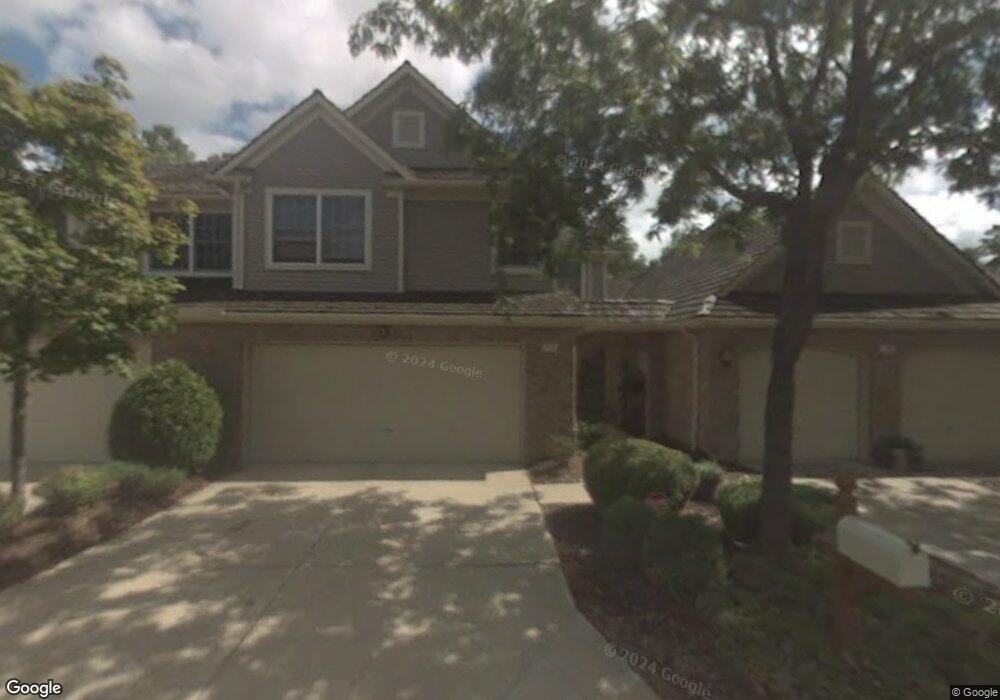
793 Brick Mill Run Unit D2 Westlake, OH 44145
Estimated Value: $392,000 - $423,000
3
Beds
3
Baths
2,272
Sq Ft
$180/Sq Ft
Est. Value
About This Home
This home is located at 793 Brick Mill Run Unit D2, Westlake, OH 44145 and is currently estimated at $408,015, approximately $179 per square foot. 793 Brick Mill Run Unit D2 is a home located in Cuyahoga County with nearby schools including Westlake Elementary School, Dover Intermediate School, and Lee Burneson Middle School.
Ownership History
Date
Name
Owned For
Owner Type
Purchase Details
Closed on
Jan 25, 2005
Sold by
Rheem Julie C and Rheem Julia C
Bought by
Coble Diane F
Current Estimated Value
Home Financials for this Owner
Home Financials are based on the most recent Mortgage that was taken out on this home.
Original Mortgage
$173,000
Interest Rate
5.77%
Mortgage Type
Unknown
Purchase Details
Closed on
Dec 8, 1998
Sold by
Zimmerman Arthur V
Bought by
Rheem Julia C and Rheem Julie C
Home Financials for this Owner
Home Financials are based on the most recent Mortgage that was taken out on this home.
Original Mortgage
$107,000
Interest Rate
6.93%
Purchase Details
Closed on
Feb 12, 1998
Sold by
Zimmerman Arthur V and Zimmerman Frances J
Bought by
Zimmerman Arthur V and Arthur V Zimmerman Revocable Trust
Purchase Details
Closed on
Jan 1, 1991
Bought by
Zimmerman Arthur and Zimmerman J
Create a Home Valuation Report for This Property
The Home Valuation Report is an in-depth analysis detailing your home's value as well as a comparison with similar homes in the area
Home Values in the Area
Average Home Value in this Area
Purchase History
| Date | Buyer | Sale Price | Title Company |
|---|---|---|---|
| Coble Diane F | $273,000 | Real Living Title Agency L | |
| Rheem Julia C | $267,000 | -- | |
| Zimmerman Arthur V | -- | -- | |
| Zimmerman Arthur | -- | -- |
Source: Public Records
Mortgage History
| Date | Status | Borrower | Loan Amount |
|---|---|---|---|
| Closed | Coble Diane F | $173,000 | |
| Previous Owner | Rheem Julia C | $107,000 |
Source: Public Records
Tax History Compared to Growth
Tax History
| Year | Tax Paid | Tax Assessment Tax Assessment Total Assessment is a certain percentage of the fair market value that is determined by local assessors to be the total taxable value of land and additions on the property. | Land | Improvement |
|---|---|---|---|---|
| 2024 | $6,217 | $131,250 | $16,170 | $115,080 |
| 2023 | $6,041 | $109,030 | $10,920 | $98,110 |
| 2022 | $5,945 | $109,025 | $10,920 | $98,105 |
| 2021 | $5,952 | $109,030 | $10,920 | $98,110 |
| 2020 | $4,991 | $83,860 | $8,400 | $75,460 |
| 2019 | $4,839 | $239,600 | $24,000 | $215,600 |
| 2018 | $4,685 | $83,860 | $8,400 | $75,460 |
| 2017 | $4,558 | $73,960 | $7,420 | $66,540 |
| 2016 | $4,534 | $73,960 | $7,420 | $66,540 |
| 2015 | $8,479 | $73,960 | $7,420 | $66,540 |
| 2014 | $8,479 | $88,060 | $8,820 | $79,240 |
Source: Public Records
Map
Nearby Homes
- 851 Brick Mill Run Unit 10
- 700 Brick Mill Run Unit 406
- 22576 Peach Tree Ln
- 7 Pond Dr
- 1330 E Melrose Dr
- 1301 Clague Rd
- 22722 Lake Rd
- 22728 Lake Rd
- 22700 Lake Rd Unit 204
- 22700 Lake Rd Unit 305
- 22700 Lake Rd Unit 406
- 22700 Lake Rd Unit 306
- 22700 Lake Rd Unit 405
- 22700 Lake Rd Unit 304
- 22700 Lake Rd Unit 504
- 22700 Lake Rd Unit 102
- 23200 Lake Rd Unit 50
- 23200 Lake Rd Unit 47
- 23200 Lake Rd Unit 30
- 1055 Medfield Dr
- 789 Brick Mill Run Unit 3
- 789 Brick Mill Run Unit C1
- 781 Brick Mill Run
- 797 Brick Mill Run
- 797 Brick Mill Run Unit 1
- 777 Brick Mill Run Unit 6
- 671 Brick Mill Run Unit C9
- 667 Brick Mill Run Unit D10
- 679 Brick Mill Run Unit B7
- 785 Brick Mill Run
- 785 Brick Mill Run Unit 4
- 671 Brick Mill Run Unit 9
- 663 Brick Mill Run
- 675 Brick Mill Run
- 819 Brick Mill Run Unit TH17
- 815 Brick Mill Run Unit 18
- 827 Brick Mill Run
- 823 Brick Mill Run
- 700 Brick Mill Run Unit 506
- 700 Brick Mill Run Unit 407