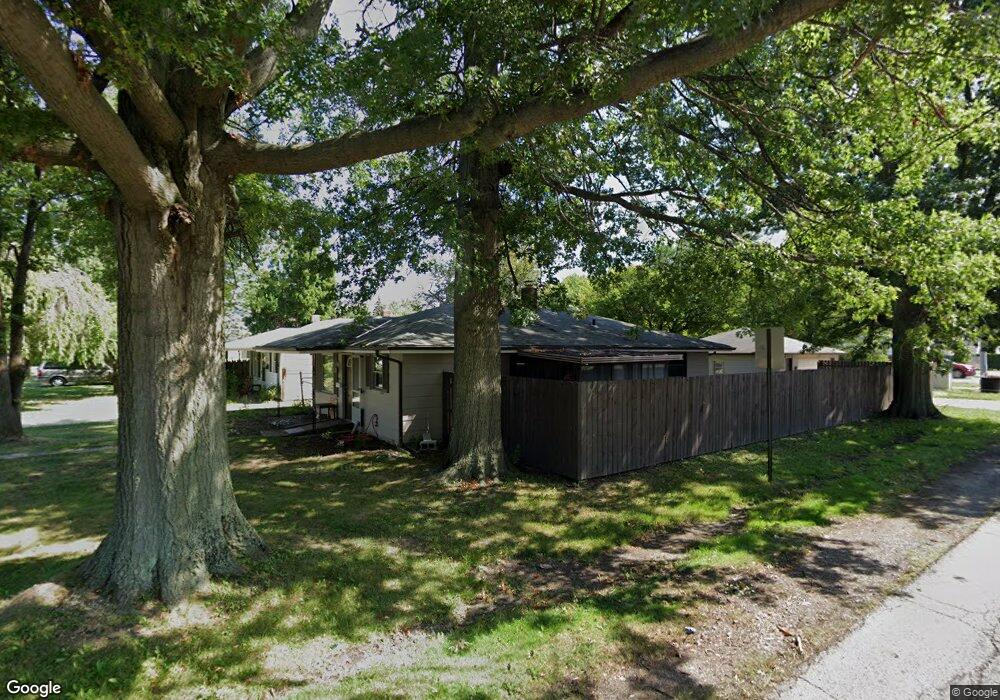
793 E 349th St Eastlake, OH 44095
Estimated Value: $153,707 - $176,000
3
Beds
2
Baths
1,118
Sq Ft
$147/Sq Ft
Est. Value
About This Home
This home is located at 793 E 349th St, Eastlake, OH 44095 and is currently estimated at $164,427, approximately $147 per square foot. 793 E 349th St is a home located in Lake County with nearby schools including Jefferson Elementary School, Willowick Middle School, and North High School.
Ownership History
Date
Name
Owned For
Owner Type
Purchase Details
Closed on
Sep 30, 2021
Sold by
Morano Steve and Morano Jennnefer
Bought by
Jeves Investment Properties Llc
Current Estimated Value
Purchase Details
Closed on
Oct 14, 2009
Sold by
The Secretary Of Veterans Affairs
Bought by
Marano Steve
Purchase Details
Closed on
May 5, 2009
Sold by
Bennett John M
Bought by
Secretary Of Veterans Affairs
Purchase Details
Closed on
May 4, 2001
Sold by
Maczuga Thomas Helen and Maczuga Helen
Bought by
Bennett John M and Bennett Cherie A
Home Financials for this Owner
Home Financials are based on the most recent Mortgage that was taken out on this home.
Original Mortgage
$98,900
Interest Rate
7.07%
Mortgage Type
VA
Purchase Details
Closed on
Jan 1, 1990
Bought by
Thomas Phillip
Create a Home Valuation Report for This Property
The Home Valuation Report is an in-depth analysis detailing your home's value as well as a comparison with similar homes in the area
Home Values in the Area
Average Home Value in this Area
Purchase History
| Date | Buyer | Sale Price | Title Company |
|---|---|---|---|
| Jeves Investment Properties Llc | -- | None Available | |
| Marano Steve | -- | Progressive Land Title | |
| Secretary Of Veterans Affairs | $58,000 | None Available | |
| Bennett John M | $97,000 | Lawyers Title | |
| Thomas Phillip | -- | -- |
Source: Public Records
Mortgage History
| Date | Status | Borrower | Loan Amount |
|---|---|---|---|
| Previous Owner | Bennett John M | $98,900 |
Source: Public Records
Tax History
| Year | Tax Paid | Tax Assessment Tax Assessment Total Assessment is a certain percentage of the fair market value that is determined by local assessors to be the total taxable value of land and additions on the property. | Land | Improvement |
|---|---|---|---|---|
| 2025 | -- | $46,370 | $11,010 | $35,360 |
| 2024 | -- | $46,370 | $11,010 | $35,360 |
| 2023 | $3,209 | $33,210 | $9,090 | $24,120 |
| 2022 | $2,191 | $33,210 | $9,090 | $24,120 |
| 2021 | $2,201 | $33,210 | $9,090 | $24,120 |
| 2020 | $2,065 | $27,670 | $7,580 | $20,090 |
| 2019 | $1,926 | $27,670 | $7,580 | $20,090 |
| 2018 | $1,902 | $25,840 | $11,890 | $13,950 |
| 2017 | $1,889 | $25,840 | $11,890 | $13,950 |
| 2016 | $1,769 | $25,840 | $11,890 | $13,950 |
| 2015 | $1,721 | $25,840 | $11,890 | $13,950 |
| 2014 | $1,635 | $25,840 | $11,890 | $13,950 |
| 2013 | $1,635 | $25,840 | $11,890 | $13,950 |
Source: Public Records
Map
Nearby Homes
- 771 E 348th St
- 35288 Beach Park Ave
- 34857 Roberts Rd
- 35477 Hobbie Dr
- 847 Audrey Dr
- 34233 Beach Park Ave
- 1045 E 347th St
- 36001 Freed Ct
- V/L 11 Carlton Dr
- V/L 12 Carlton Dr
- V/L 13-14 Carlton Dr
- 799 Stevens Blvd
- 1085 Stevens Blvd
- 1096 Stevens Blvd
- 33862 Beachpark Dr
- 36405 Stevens Blvd
- 1259 E 351st St
- 34114 Lake Shore Blvd
- 660 Rokeby Rd
- 1222 E 360th St
- 789 E 349th St
- 785 E 349th St
- 781 E 349th St
- 34948 Beach Park Ave
- 775 E 349th St
- 34988 Beach Park Ave
- 34912 Beachpark Dr
- 34912 Beach Park Ave
- 794 E 349th St
- 34888 Beachpark Dr
- 771 E 349th St
- 786 E 349th St
- 34888 Beach Park Ave
- 782 E 349th St
- 765 E 349th St
- 776 E 349th St
- 34868 Beach Park Ave
- 35101 Beach Park Ave
- 772 E 349th St
- 761 E 349th St
Your Personal Tour Guide
Ask me questions while you tour the home.