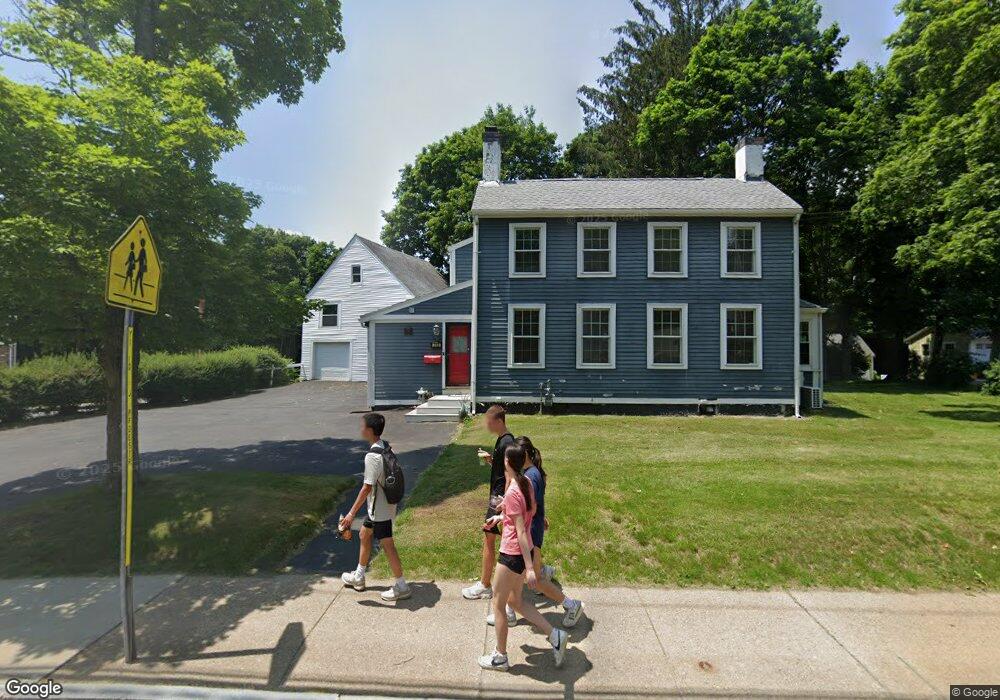
793 High St Westwood, MA 02090
Estimated Value: $975,501 - $1,287,000
4
Beds
2
Baths
2,232
Sq Ft
$480/Sq Ft
Est. Value
About This Home
This home is located at 793 High St, Westwood, MA 02090 and is currently estimated at $1,072,375, approximately $480 per square foot. 793 High St is a home located in Norfolk County with nearby schools including Westwood High School, St Catherine Of Siena School, and Xaverian Brothers High School.
Ownership History
Date
Name
Owned For
Owner Type
Purchase Details
Closed on
Oct 3, 2008
Sold by
Smith Michael J and Smith Noreen
Bought by
Wong Chak H and Lee Monica Y C
Current Estimated Value
Home Financials for this Owner
Home Financials are based on the most recent Mortgage that was taken out on this home.
Original Mortgage
$272,000
Outstanding Balance
$181,826
Interest Rate
6.54%
Mortgage Type
Purchase Money Mortgage
Estimated Equity
$890,549
Purchase Details
Closed on
Mar 19, 1993
Sold by
Thomas Susan R
Bought by
Smith Michael J and Smith Noreen
Home Financials for this Owner
Home Financials are based on the most recent Mortgage that was taken out on this home.
Original Mortgage
$65,000
Interest Rate
7.75%
Mortgage Type
Purchase Money Mortgage
Create a Home Valuation Report for This Property
The Home Valuation Report is an in-depth analysis detailing your home's value as well as a comparison with similar homes in the area
Home Values in the Area
Average Home Value in this Area
Purchase History
| Date | Buyer | Sale Price | Title Company |
|---|---|---|---|
| Wong Chak H | $340,000 | -- | |
| Smith Michael J | $82,000 | -- |
Source: Public Records
Mortgage History
| Date | Status | Borrower | Loan Amount |
|---|---|---|---|
| Open | Smith Michael J | $140,000 | |
| Open | Wong Chak H | $272,000 | |
| Previous Owner | Smith Michael J | $297,500 | |
| Previous Owner | Smith Michael J | $65,000 |
Source: Public Records
Tax History Compared to Growth
Tax History
| Year | Tax Paid | Tax Assessment Tax Assessment Total Assessment is a certain percentage of the fair market value that is determined by local assessors to be the total taxable value of land and additions on the property. | Land | Improvement |
|---|---|---|---|---|
| 2025 | $10,221 | $798,500 | $412,600 | $385,900 |
| 2024 | $9,504 | $741,900 | $392,800 | $349,100 |
| 2023 | $9,125 | $638,100 | $327,400 | $310,700 |
| 2022 | $8,685 | $585,650 | $289,450 | $296,200 |
| 2021 | $8,809 | $596,000 | $275,750 | $320,250 |
| 2020 | $7,934 | $546,800 | $269,800 | $277,000 |
| 2019 | $6,990 | $477,150 | $256,850 | $220,300 |
| 2018 | $6,939 | $459,850 | $256,850 | $203,000 |
| 2017 | $6,564 | $450,500 | $256,850 | $193,650 |
| 2016 | $4,834 | $329,750 | $256,850 | $72,900 |
| 2015 | $4,894 | $321,100 | $256,850 | $64,250 |
Source: Public Records
Map
Nearby Homes
- 197 Hartford St
- 207 Hartford St
- 49 Fisher St
- 39 Bayley St
- 60 Warwick Dr
- 4 Shoestring Ln
- 132 Thatcher St
- 36 Kingswood Rd
- 401 Sandy Valley Rd
- 17 Royal Ct
- 618 Nahatan St
- 20 Longmeadow Dr
- 95 Arcadia Rd
- 66 Crestwood Cir
- 151 Arcadia Rd
- 26 Longmeadow Dr
- 140 Burgess Ave
- 39 Westbrook Ln
- 470 Nahatan St
- 14 Ruel Dr