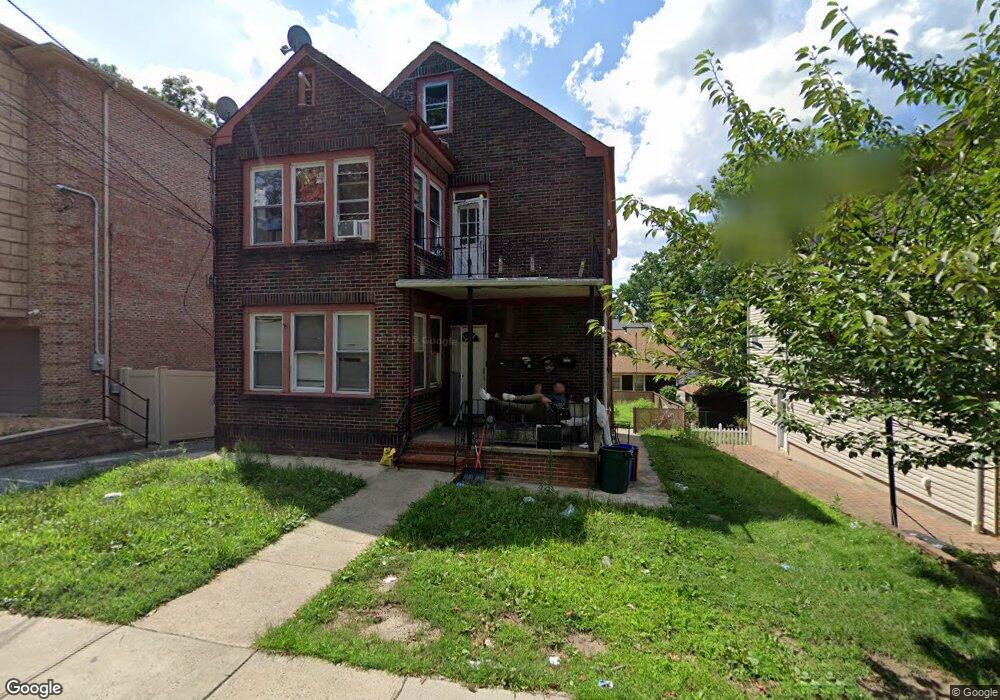
793 Inwood Terrace Unit 2 Cliffside Park, NJ 07010
Estimated Value: $891,000 - $1,104,000
6
Beds
2
Baths
2,903
Sq Ft
$339/Sq Ft
Est. Value
About This Home
This home is located at 793 Inwood Terrace Unit 2, Cliffside Park, NJ 07010 and is currently estimated at $983,556, approximately $338 per square foot. 793 Inwood Terrace Unit 2 is a home located in Bergen County with nearby schools including Cliffside Park High School.
Ownership History
Date
Name
Owned For
Owner Type
Purchase Details
Closed on
Apr 22, 2022
Sold by
Moya Investments Llc
Bought by
Inwood Terrace Partners Llc
Current Estimated Value
Purchase Details
Closed on
Jan 22, 2020
Sold by
Haggar Gilbert M and Haggar Vilma
Bought by
Moya Investments Llc
Home Financials for this Owner
Home Financials are based on the most recent Mortgage that was taken out on this home.
Original Mortgage
$335,000
Interest Rate
12%
Mortgage Type
New Conventional
Purchase Details
Closed on
May 14, 2002
Sold by
Osso Joseph
Bought by
Haggar Gilbert M and Haggar Wilma
Home Financials for this Owner
Home Financials are based on the most recent Mortgage that was taken out on this home.
Original Mortgage
$350,000
Interest Rate
7.15%
Create a Home Valuation Report for This Property
The Home Valuation Report is an in-depth analysis detailing your home's value as well as a comparison with similar homes in the area
Home Values in the Area
Average Home Value in this Area
Purchase History
| Date | Buyer | Sale Price | Title Company |
|---|---|---|---|
| Inwood Terrace Partners Llc | $668,000 | -- | |
| Inwood Terrace Partners Llc | $668,000 | None Listed On Document | |
| Moya Investments Llc | $370,000 | Integra Title & Abstract Llc | |
| Haggar Gilbert M | $438,000 | -- |
Source: Public Records
Mortgage History
| Date | Status | Borrower | Loan Amount |
|---|---|---|---|
| Previous Owner | Moya Investments Llc | $335,000 | |
| Previous Owner | Haggar Gilbert M | $350,000 |
Source: Public Records
Tax History Compared to Growth
Tax History
| Year | Tax Paid | Tax Assessment Tax Assessment Total Assessment is a certain percentage of the fair market value that is determined by local assessors to be the total taxable value of land and additions on the property. | Land | Improvement |
|---|---|---|---|---|
| 2025 | $13,995 | $507,800 | $255,000 | $252,800 |
| 2024 | $13,589 | $507,800 | $255,000 | $252,800 |
| 2023 | $13,025 | $507,800 | $255,000 | $252,800 |
| 2022 | $13,025 | $507,800 | $255,000 | $252,800 |
| 2021 | $12,781 | $507,800 | $255,000 | $252,800 |
| 2020 | $12,634 | $507,800 | $255,000 | $252,800 |
| 2019 | $12,400 | $507,800 | $255,000 | $252,800 |
| 2018 | $12,380 | $507,800 | $255,000 | $252,800 |
| 2017 | $12,147 | $507,800 | $255,000 | $252,800 |
| 2016 | $11,908 | $507,800 | $255,000 | $252,800 |
| 2015 | $11,552 | $507,800 | $255,000 | $252,800 |
| 2014 | $11,233 | $507,800 | $255,000 | $252,800 |
Source: Public Records
Map
Nearby Homes
- 809 Jassamine Way Unit 809
- 801 W End Ave
- 792 Kingsland Ave
- 1015 Jassamine Way
- 764 Jefferson Ave Unit C0764
- 755 Jefferson Ave
- 743 Kingsland Ave
- 795 Fairview Ln Unit C0795
- 768 Florence Place
- 1044 Fairview Ln
- 709 Kingsland Ave
- 762 Williams Place Unit A
- 762 Williams Place
- 118 Bergen Blvd Unit 3A
- 1068 Fairview Ln
- 1087 Kingsland Ln
- 290 Columbia Ave
- 1062 Anderson Ave
- 458 Shannon Place
- 811 Edgewood Ln Unit b
- 793 Inwood Terrace
- 789 Inwood Terrace
- 789 Inwood Terrace Unit B
- 795 Inwood Terrace
- 795 Inwood Terrace Unit 1
- 785 Inwood Terrace
- 794 W End Ave
- 790 W End Ave
- 796 Inwood Terrace Unit 1
- 796 Inwood Terrace
- 800 Inwood Terrace
- 800 Inwood Terrace Unit B
- 800 Inwood Terrace Unit A
- 794 Inwood Terrace
- 807A Inwood Terrace Unit A
- 431 Aurora Ave
- 431 Aurora Ave Unit B
- 431 Aurora Ave Unit A
- 807B Inwood Terrace
- 788 W End Ave