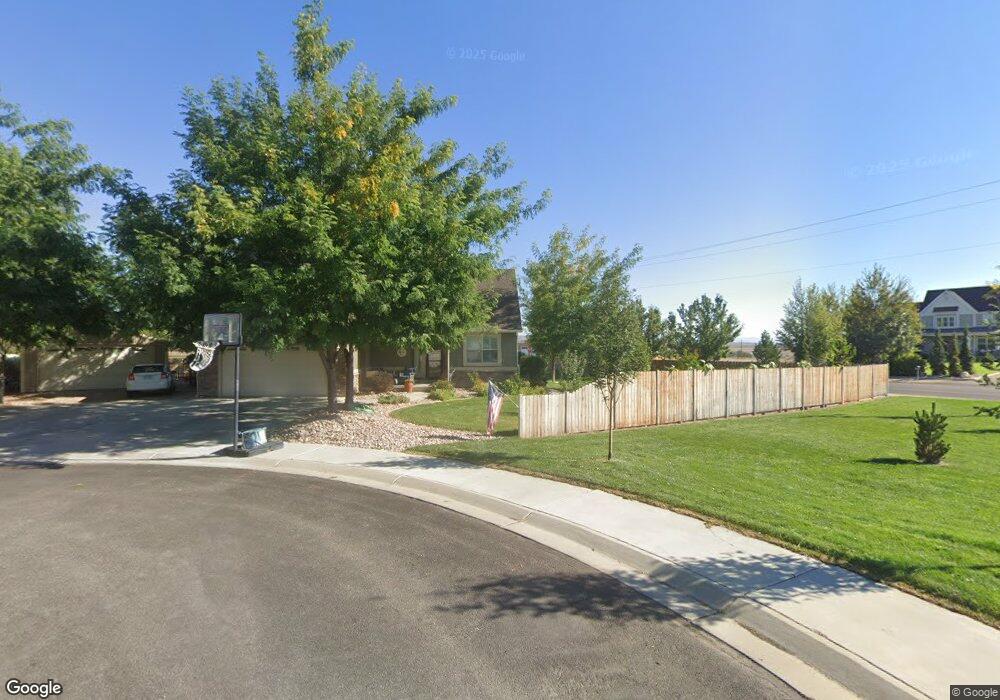
793 Jambee Ct Vernal, UT 84078
Estimated Value: $423,692 - $560,000
Studio
--
Bath
2,553
Sq Ft
$189/Sq Ft
Est. Value
About This Home
This home is located at 793 Jambee Ct, Vernal, UT 84078 and is currently estimated at $482,673, approximately $189 per square foot. 793 Jambee Ct is a home with nearby schools including Naples School, Vernal Middle School, and Uintah Middle School.
Ownership History
Date
Name
Owned For
Owner Type
Purchase Details
Closed on
Jan 13, 2011
Sold by
Carter Kym Roann
Bought by
Carter Wavie Ray
Current Estimated Value
Purchase Details
Closed on
Aug 16, 2007
Sold by
Rk Haws Development Inc
Bought by
Carter Wavie R
Home Financials for this Owner
Home Financials are based on the most recent Mortgage that was taken out on this home.
Original Mortgage
$190,000
Outstanding Balance
$125,164
Interest Rate
6.75%
Mortgage Type
Construction
Estimated Equity
$357,509
Purchase Details
Closed on
Aug 1, 2007
Sold by
Carter Wavie R
Bought by
Carter Wavie R and Carter Kym R
Home Financials for this Owner
Home Financials are based on the most recent Mortgage that was taken out on this home.
Original Mortgage
$190,000
Outstanding Balance
$125,164
Interest Rate
6.75%
Mortgage Type
Construction
Estimated Equity
$357,509
Create a Home Valuation Report for This Property
The Home Valuation Report is an in-depth analysis detailing your home's value as well as a comparison with similar homes in the area
Purchase History
| Date | Buyer | Sale Price | Title Company |
|---|---|---|---|
| Carter Wavie Ray | -- | -- | |
| Carter Wavie R | -- | -- | |
| Carter Wavie R | -- | -- |
Source: Public Records
Mortgage History
| Date | Status | Borrower | Loan Amount |
|---|---|---|---|
| Open | Carter Wavie R | $190,000 |
Source: Public Records
Tax History
| Year | Tax Paid | Tax Assessment Tax Assessment Total Assessment is a certain percentage of the fair market value that is determined by local assessors to be the total taxable value of land and additions on the property. | Land | Improvement |
|---|---|---|---|---|
| 2024 | $2,172 | $245,966 | $22,078 | $223,888 |
| 2023 | $2,129 | $239,224 | $20,729 | $218,495 |
| 2022 | $1,967 | $184,804 | $20,729 | $164,075 |
| 2021 | $1,988 | $84,768 | $11,401 | $73,367 |
| 2020 | $1,937 | $154,123 | $20,729 | $133,394 |
| 2019 | $1,685 | $132,451 | $22,000 | $110,451 |
| 2018 | $1,615 | $127,191 | $22,000 | $105,191 |
| 2017 | $16 | $129,941 | $24,750 | $105,191 |
| 2016 | $1,544 | $133,195 | $24,750 | $108,445 |
| 2015 | $1,487 | $138,902 | $24,750 | $114,152 |
| 2014 | $1,443 | $136,152 | $22,000 | $114,152 |
| 2013 | $1,473 | $136,152 | $22,000 | $114,152 |
Source: Public Records
Map
Nearby Homes
- 1720 E 500 S
- 1698 E 500 S
- 1550 S 800 E Unit 19
- 2102 E 1820 S
- 2580 E 500 N
- 1519 S 725 E Unit 22
- 422 E 500 S Unit C
- 394 E 600 S Unit B
- 384 E 535 S
- 1264 S 425 E
- 190 N 500 E Unit A202
- 190 N 500 E Unit A101
- 190 N 500 E Unit A206
- 190 N 500 E Unit A406
- 190 N 500 E Unit A304
- 190 N 500 E Unit A403
- 190 N 500 E Unit A301
- 190 N 500 E Unit A105
- 561 E 250 N
- 1676 E 2500 S
- 792 Jambee Ct
- 802 Jambee Ct
- 812 Jambee Ct
- 812 S Jambee Ct
- 807 Joshua St Unit 34
- 807 Joshua St
- 795 Joshua St
- 800 S 2000 E Unit 4
- 800 S 2000 E Unit 7
- 800 S 2000 E Unit 6
- 800 S 2000 E Unit 36
- 800 S 2000 E Unit 30
- 800 S 2000 E
- 820 S Jambee Ct
- 820 Jambee Ct
- 761 S 2000 E
- 753 S 2000 E
- 813 Joshua St
- 813 S Joshua Ct
- 739 S 2000 E
Your Personal Tour Guide
Ask me questions while you tour the home.