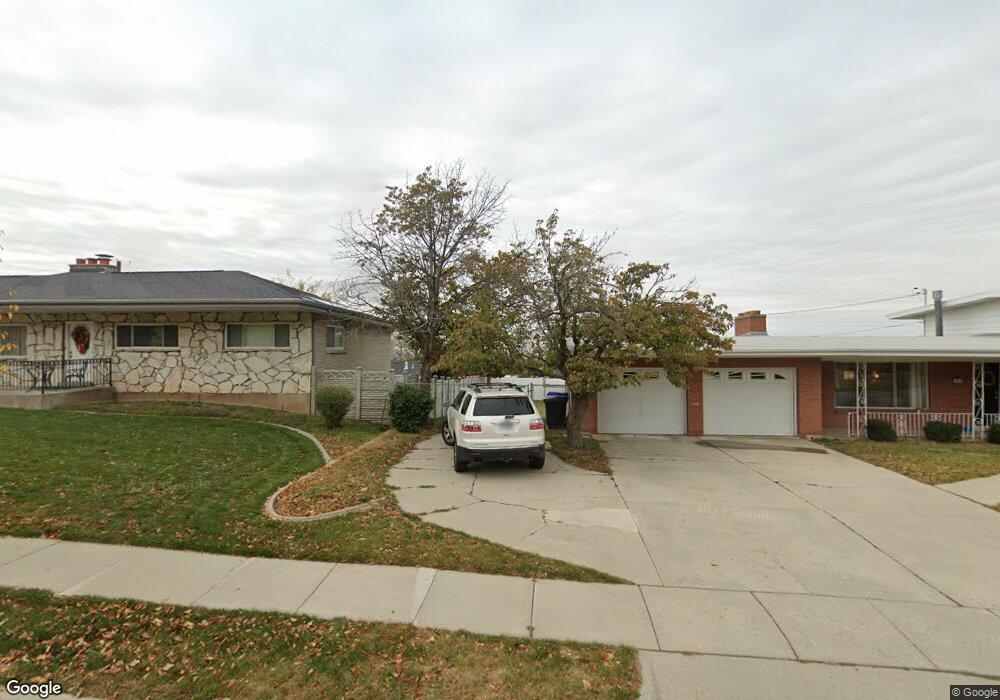
793 N 650 E Bountiful, UT 84010
Estimated Value: $498,000 - $622,000
4
Beds
3
Baths
1,075
Sq Ft
$513/Sq Ft
Est. Value
About This Home
This home is located at 793 N 650 E, Bountiful, UT 84010 and is currently estimated at $550,997, approximately $512 per square foot. 793 N 650 E is a home located in Davis County with nearby schools including Tolman School, Bountiful Junior High School, and Bountiful High School.
Ownership History
Date
Name
Owned For
Owner Type
Purchase Details
Closed on
Oct 10, 2019
Sold by
Thomas Desmond Aaron and Thomas Brandi
Bought by
Gabrielsen Paul J and Gabrielsen Bethany
Current Estimated Value
Home Financials for this Owner
Home Financials are based on the most recent Mortgage that was taken out on this home.
Original Mortgage
$269,000
Outstanding Balance
$235,137
Interest Rate
3.5%
Mortgage Type
New Conventional
Estimated Equity
$315,860
Purchase Details
Closed on
Jan 2, 2008
Sold by
Wallace Martha E
Bought by
Thomas Desmond Aaron and Thomas Brandi
Home Financials for this Owner
Home Financials are based on the most recent Mortgage that was taken out on this home.
Original Mortgage
$202,817
Interest Rate
6.15%
Mortgage Type
FHA
Create a Home Valuation Report for This Property
The Home Valuation Report is an in-depth analysis detailing your home's value as well as a comparison with similar homes in the area
Purchase History
| Date | Buyer | Sale Price | Title Company |
|---|---|---|---|
| Gabrielsen Paul J | -- | Us Title Company Of L | |
| Thomas Desmond Aaron | -- | Bonneville Superior Title |
Source: Public Records
Mortgage History
| Date | Status | Borrower | Loan Amount |
|---|---|---|---|
| Open | Gabrielsen Paul J | $269,000 | |
| Previous Owner | Thomas Desmond Aaron | $202,817 |
Source: Public Records
Tax History
| Year | Tax Paid | Tax Assessment Tax Assessment Total Assessment is a certain percentage of the fair market value that is determined by local assessors to be the total taxable value of land and additions on the property. | Land | Improvement |
|---|---|---|---|---|
| 2025 | $3,029 | $271,150 | $142,330 | $128,820 |
| 2024 | $2,857 | $265,650 | $131,094 | $134,556 |
| 2023 | $2,842 | $481,000 | $239,460 | $241,540 |
| 2022 | $2,996 | $278,850 | $127,757 | $151,093 |
| 2021 | $2,755 | $393,000 | $190,034 | $202,966 |
| 2020 | $2,416 | $345,000 | $172,997 | $172,003 |
| 2019 | $2,184 | $302,000 | $166,512 | $135,488 |
| 2018 | $2,027 | $275,000 | $155,205 | $119,795 |
| 2016 | $1,789 | $131,725 | $51,148 | $80,577 |
| 2015 | $1,757 | $122,045 | $51,148 | $70,897 |
| 2014 | $1,577 | $111,925 | $51,148 | $60,777 |
| 2013 | -- | $105,031 | $44,319 | $60,712 |
Source: Public Records
Map
Nearby Homes
- 513 N 400 E Unit 14B
- 453 N 400 E Unit 7-D
- 978 N 170 E
- 214 E 1250 N
- 683 E 100 N
- 129 N 800 E
- 908 Northern Hills Dr Unit 3
- 933 Northern Hills Cir
- 6 N 800 E
- 17 E 400 N Unit 19B
- 1420 N Main St
- 49 E 200 N Unit 4
- 41 E 200 N Unit 6
- 967 S Courtyard Ln
- 55 E 200 N Unit 2
- 51 E 200 N Unit 3
- 698 E 200 S
- 256 N Main St
- 254 N Main St
- 252 N Main St
Your Personal Tour Guide
Ask me questions while you tour the home.