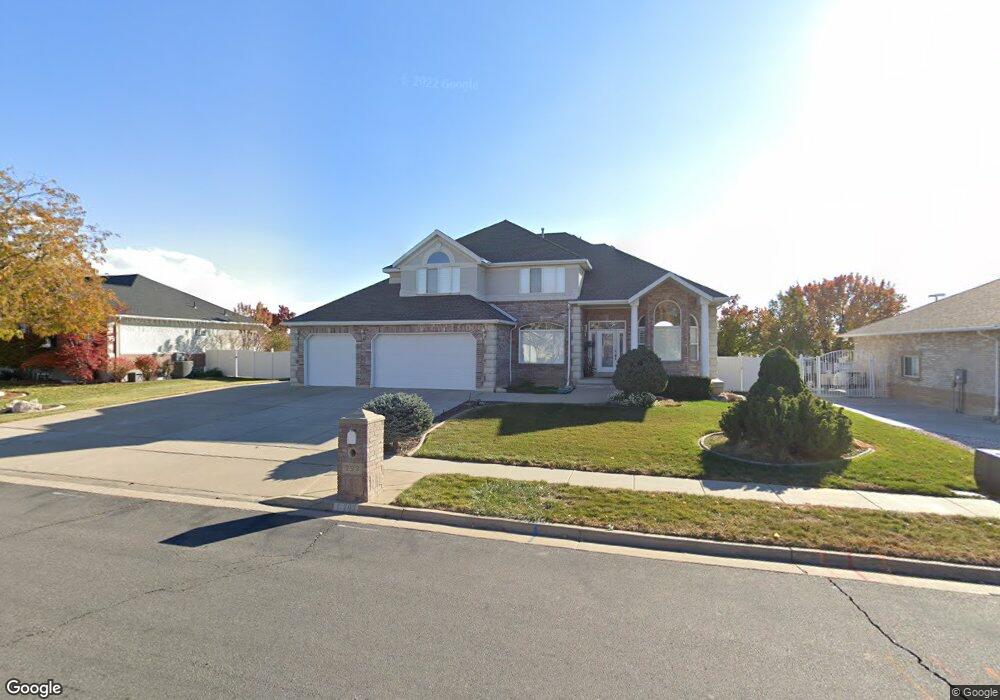
793 W 2525 S Syracuse, UT 84075
Estimated Value: $634,468 - $726,000
4
Beds
3
Baths
3,009
Sq Ft
$224/Sq Ft
Est. Value
About This Home
This home is located at 793 W 2525 S, Syracuse, UT 84075 and is currently estimated at $674,867, approximately $224 per square foot. 793 W 2525 S is a home located in Davis County with nearby schools including Bluff Ridge Elementary, Legacy Junior High School, and Clearfield High School.
Ownership History
Date
Name
Owned For
Owner Type
Purchase Details
Closed on
May 17, 2016
Sold by
Brower Marla
Bought by
Galvan Ricci Phillips and Marla Brower Investment Trust
Current Estimated Value
Purchase Details
Closed on
Apr 16, 2012
Sold by
Brower Steven C and Brower Marla
Bought by
Brower Marla
Home Financials for this Owner
Home Financials are based on the most recent Mortgage that was taken out on this home.
Original Mortgage
$155,000
Interest Rate
3.84%
Mortgage Type
New Conventional
Purchase Details
Closed on
Nov 27, 1996
Sold by
Hall Enterprises Inc
Bought by
Brower Steven C and Brower Marla
Home Financials for this Owner
Home Financials are based on the most recent Mortgage that was taken out on this home.
Original Mortgage
$176,000
Interest Rate
7.91%
Create a Home Valuation Report for This Property
The Home Valuation Report is an in-depth analysis detailing your home's value as well as a comparison with similar homes in the area
Home Values in the Area
Average Home Value in this Area
Purchase History
| Date | Buyer | Sale Price | Title Company |
|---|---|---|---|
| Galvan Ricci Phillips | -- | None Available | |
| Brower Marla | -- | American Preferred Ti | |
| Brower Steven C | -- | Bonneville Title Company Inc |
Source: Public Records
Mortgage History
| Date | Status | Borrower | Loan Amount |
|---|---|---|---|
| Previous Owner | Brower Marla | $155,000 | |
| Previous Owner | Brower Steven C | $176,000 |
Source: Public Records
Tax History
| Year | Tax Paid | Tax Assessment Tax Assessment Total Assessment is a certain percentage of the fair market value that is determined by local assessors to be the total taxable value of land and additions on the property. | Land | Improvement |
|---|---|---|---|---|
| 2025 | $514 | $336,050 | $125,892 | $210,158 |
| 2024 | -- | $321,200 | $105,008 | $216,192 |
| 2023 | $3,209 | $568,000 | $146,264 | $421,736 |
| 2022 | $3,435 | $333,300 | $84,074 | $249,226 |
| 2021 | $2,963 | $445,000 | $124,343 | $320,657 |
| 2020 | $2,689 | $391,000 | $107,871 | $283,129 |
| 2019 | $2,626 | $377,000 | $105,983 | $271,017 |
| 2018 | $2,484 | $354,000 | $102,064 | $251,936 |
| 2016 | $2,285 | $170,721 | $39,155 | $131,566 |
| 2015 | $2,302 | $163,846 | $39,155 | $124,691 |
| 2014 | $2,190 | $158,811 | $39,155 | $119,656 |
| 2013 | -- | $156,822 | $36,967 | $119,855 |
Source: Public Records
Map
Nearby Homes
Your Personal Tour Guide
Ask me questions while you tour the home.