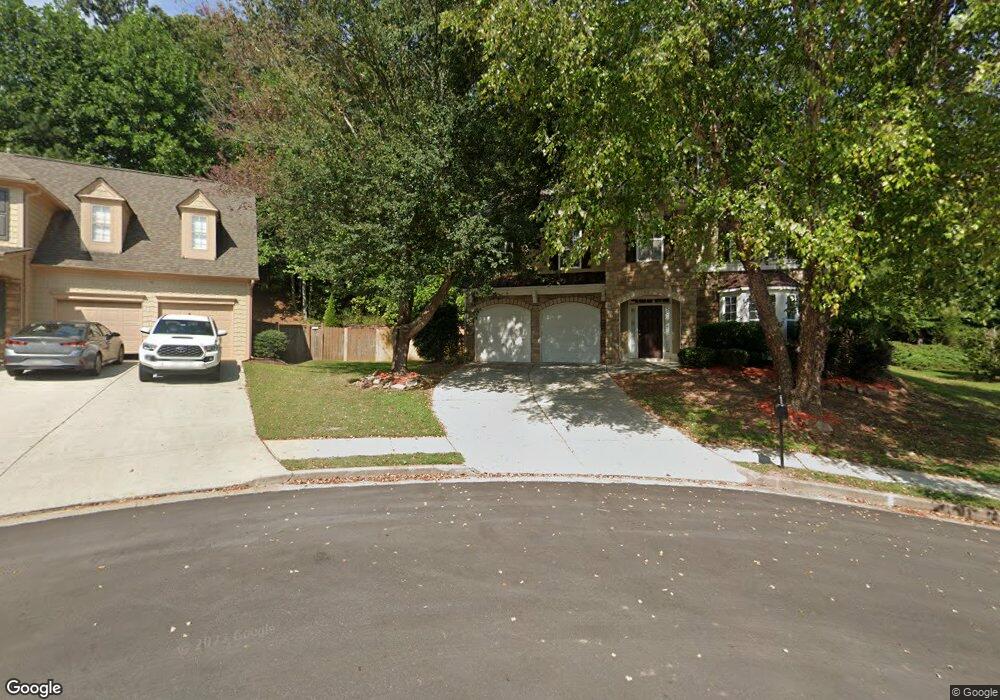
793 Win West Crossing NE Auburn, GA 30011
Estimated Value: $443,000 - $475,000
4
Beds
3
Baths
2,940
Sq Ft
$157/Sq Ft
Est. Value
About This Home
This home is located at 793 Win West Crossing NE, Auburn, GA 30011 and is currently estimated at $462,016, approximately $157 per square foot. 793 Win West Crossing NE is a home located in Gwinnett County with nearby schools including Mulberry Elementary School, Dacula Middle School, and Dacula High School.
Ownership History
Date
Name
Owned For
Owner Type
Purchase Details
Closed on
Jul 13, 2018
Sold by
Hp Georgia I Llc
Bought by
Hpa Borrower 2018 1 Ms Llc
Current Estimated Value
Purchase Details
Closed on
Oct 4, 2017
Sold by
Lappert Lisa Milroy
Bought by
Hp Georgia I Llc
Purchase Details
Closed on
Nov 28, 2006
Sold by
King Toby L and King Kelly
Bought by
Milroy Lisa
Home Financials for this Owner
Home Financials are based on the most recent Mortgage that was taken out on this home.
Original Mortgage
$33,097
Interest Rate
6.29%
Mortgage Type
Stand Alone Refi Refinance Of Original Loan
Purchase Details
Closed on
Apr 23, 2004
Sold by
D R Horton Inc
Bought by
King Toby L and King Kelly
Home Financials for this Owner
Home Financials are based on the most recent Mortgage that was taken out on this home.
Original Mortgage
$191,854
Interest Rate
8.15%
Mortgage Type
New Conventional
Create a Home Valuation Report for This Property
The Home Valuation Report is an in-depth analysis detailing your home's value as well as a comparison with similar homes in the area
Home Values in the Area
Average Home Value in this Area
Purchase History
| Date | Buyer | Sale Price | Title Company |
|---|---|---|---|
| Hpa Borrower 2018 1 Ms Llc | -- | -- | |
| Hp Georgia I Llc | $228,750 | -- | |
| Milroy Lisa | $220,700 | -- | |
| King Toby L | $213,200 | -- |
Source: Public Records
Mortgage History
| Date | Status | Borrower | Loan Amount |
|---|---|---|---|
| Previous Owner | Milroy Lisa | $33,097 | |
| Previous Owner | King Toby L | $191,854 |
Source: Public Records
Tax History Compared to Growth
Tax History
| Year | Tax Paid | Tax Assessment Tax Assessment Total Assessment is a certain percentage of the fair market value that is determined by local assessors to be the total taxable value of land and additions on the property. | Land | Improvement |
|---|---|---|---|---|
| 2024 | $4,988 | $153,680 | $36,000 | $117,680 |
| 2023 | $4,988 | $152,560 | $32,000 | $120,560 |
| 2022 | $3,767 | $97,120 | $20,400 | $76,720 |
| 2021 | $3,815 | $97,120 | $20,400 | $76,720 |
| 2020 | $3,836 | $97,120 | $20,400 | $76,720 |
| 2019 | $3,539 | $92,600 | $20,400 | $72,200 |
| 2018 | $3,434 | $89,560 | $20,400 | $69,160 |
| 2016 | $2,904 | $74,000 | $14,400 | $59,600 |
| 2015 | $2,394 | $58,720 | $12,000 | $46,720 |
| 2014 | -- | $58,720 | $12,000 | $46,720 |
Source: Public Records
Map
Nearby Homes
- 753 Win Crossing W
- 738 Key Largo Ct NE
- 4001 Triton Ives Dr
- 893 Whitfield Oak Rd
- 878 W Union Grove Cir
- 858 W Union Grove Cir
- 1109 Woodtrace Ln
- Riverton Plan at Sierra Creek
- Mercer Plan at Sierra Creek
- Wingate Plan at Sierra Creek
- Continental Plan at Sierra Creek
- 1008 Woodtrace Ln
- 4293 Saddlecreek Ct
- 692 W Union Grove Cir
- 4317 Azalea Ridge Dr
- 4266 Azalea Ridge Dr
- 4297 Azalea Ridge Dr
- 4286 Azalea Ridge Dr
- 793 Win West Crossing
- 793 Win West Crossing
- 793 Win Crossing W
- 783 Win West Crossing Unit 1
- 803 Win Crossing W
- 803 Win Crossing W Unit 1
- 803 Win West Crossing Unit 1
- 867 Win Crossing W
- 773 Win West Crossing Unit 1
- 802 Win Crossing W
- 856 Win Crossing W
- 802 Win West Crossing
- 782 Win Crossing W
- 782 Win West Crossing NE
- 782 Win West Crossing
- 792 Win West Crossing Unit 1
- 772 Win West Crossing NE
- 772 Win Crossing W
- 772 Win West Crossing
- 763 Win West Crossing Unit 1