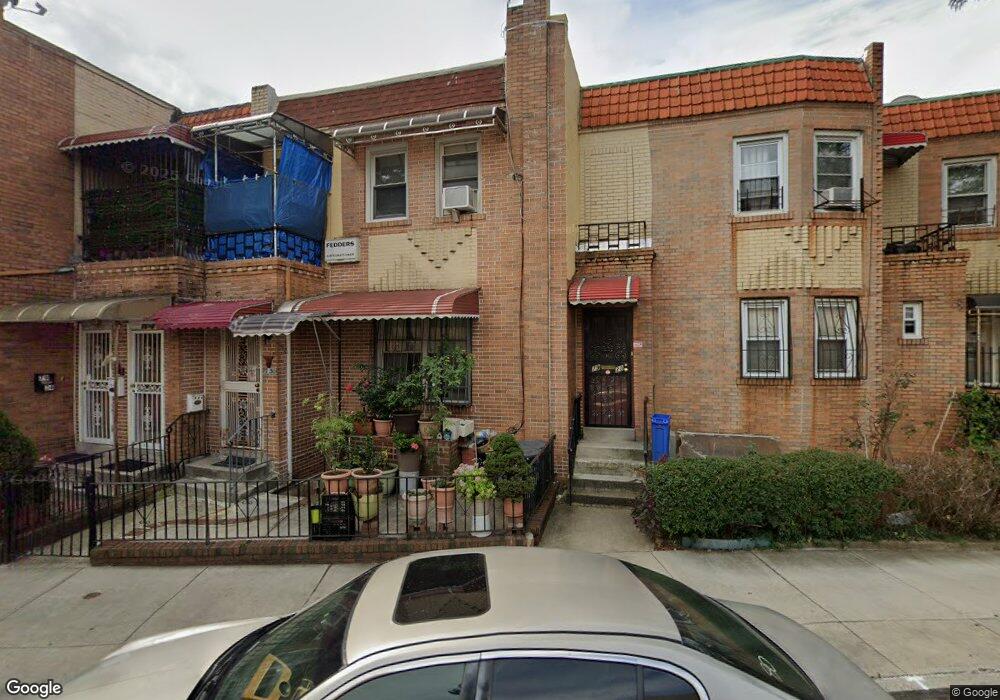
7930 Calamus Ave Elmhurst, NY 11373
Maspeth NeighborhoodEstimated Value: $901,491 - $1,154,000
--
Bed
--
Bath
1,320
Sq Ft
$796/Sq Ft
Est. Value
About This Home
This home is located at 7930 Calamus Ave, Elmhurst, NY 11373 and is currently estimated at $1,050,373, approximately $795 per square foot. 7930 Calamus Ave is a home located in Queens County with nearby schools including Ps 58 School Of Heroes, IS 73 - The Frank Sansivieri School, and Newtown High School.
Ownership History
Date
Name
Owned For
Owner Type
Purchase Details
Closed on
Jun 24, 2010
Sold by
Liu Yi
Bought by
Chen Jin Qiang
Current Estimated Value
Home Financials for this Owner
Home Financials are based on the most recent Mortgage that was taken out on this home.
Original Mortgage
$400,000
Outstanding Balance
$264,534
Interest Rate
4.78%
Estimated Equity
$785,840
Purchase Details
Closed on
Jul 9, 2008
Sold by
Zheng Hui Yu
Bought by
Liu Hong Zhuan and Liu Yi
Purchase Details
Closed on
Feb 11, 2008
Sold by
The Helen I Rosenberger Revocable Trust
Bought by
Zheng Hui Yu
Home Financials for this Owner
Home Financials are based on the most recent Mortgage that was taken out on this home.
Original Mortgage
$339,300
Interest Rate
5.9%
Mortgage Type
Purchase Money Mortgage
Purchase Details
Closed on
Apr 5, 2004
Sold by
Rosenberger Helen I and % Arvest Trust Company
Bought by
Helen I Rosenberger Trust Dated /2004 and Arvest Trust Company Trustee
Create a Home Valuation Report for This Property
The Home Valuation Report is an in-depth analysis detailing your home's value as well as a comparison with similar homes in the area
Home Values in the Area
Average Home Value in this Area
Purchase History
| Date | Buyer | Sale Price | Title Company |
|---|---|---|---|
| Chen Jin Qiang | $595,000 | -- | |
| Liu Hong Zhuan | -- | -- | |
| Liu Hong Zhuan | -- | -- | |
| Zheng Hui Yu | $522,000 | -- | |
| Zheng Hui Yu | $522,000 | -- | |
| Helen I Rosenberger Trust Dated /2004 | -- | -- | |
| Helen I Rosenberger Trust Dated /2004 | -- | -- |
Source: Public Records
Mortgage History
| Date | Status | Borrower | Loan Amount |
|---|---|---|---|
| Open | Chen Jin Qiang | $400,000 | |
| Previous Owner | Zheng Hui Yu | $339,300 |
Source: Public Records
Tax History Compared to Growth
Tax History
| Year | Tax Paid | Tax Assessment Tax Assessment Total Assessment is a certain percentage of the fair market value that is determined by local assessors to be the total taxable value of land and additions on the property. | Land | Improvement |
|---|---|---|---|---|
| 2025 | $7,916 | $41,777 | $13,122 | $28,655 |
| 2024 | $7,916 | $39,413 | $11,872 | $27,541 |
| 2023 | $7,916 | $39,413 | $11,018 | $28,395 |
| 2022 | $7,550 | $58,260 | $16,320 | $41,940 |
| 2021 | $7,766 | $54,060 | $16,320 | $37,740 |
| 2020 | $7,369 | $55,440 | $16,320 | $39,120 |
| 2019 | $6,871 | $52,860 | $16,320 | $36,540 |
| 2018 | $6,695 | $32,844 | $10,737 | $22,107 |
| 2017 | $6,425 | $31,518 | $11,507 | $20,011 |
| 2016 | $6,148 | $31,518 | $11,507 | $20,011 |
| 2015 | $3,586 | $29,012 | $15,158 | $13,854 |
| 2014 | $3,586 | $27,370 | $14,276 | $13,094 |
Source: Public Records
Map
Nearby Homes
- 79-19 Calamus Ave
- 74-49 Calamus Ave Unit 51
- 74-47 Calamus Ave Unit 48
- 79-15 Kneeland Ave
- 74-29 Calamus Ave Unit 20
- 84-38 Grand Ave
- 5119 Ireland St
- 73-37 52nd Ave
- 79-10 Grand Ave
- 52-57 84th St
- 53-16 Haspel St
- 86-04 Grand Ave Unit 2D
- 5434 83rd St
- 7332 53rd Rd
- 81-14 Queens Blvd Unit PH6C
- 51-21 Goldsmith St
- 71-22 Calamus Ave
- 52-22 van Loon St
- 52-79 72nd St
- 0 Island Rd Unit S1604113
- 7932 Calamus Ave
- 79-32 Calamus Ave
- 7926 Calamus Ave
- 79-37 Elks Rd
- 7937 Elks Rd
- 7935 Elks Rd
- 7922 Calamus Ave
- 7933 Elks Rd
- 7920 Calamus Ave
- 7931 Elks Rd
- 7944 Elks Rd
- 7948 Elks Rd
- 79-25 Calamus Ave
- 7918 Calamus Ave
- 79-29 Elks Rd
- 7929 Elks Rd
- 7931 Calamus Ave
- 7942 Calamus Ave
- 7929 Calamus Ave
- 7927 Calamus Ave