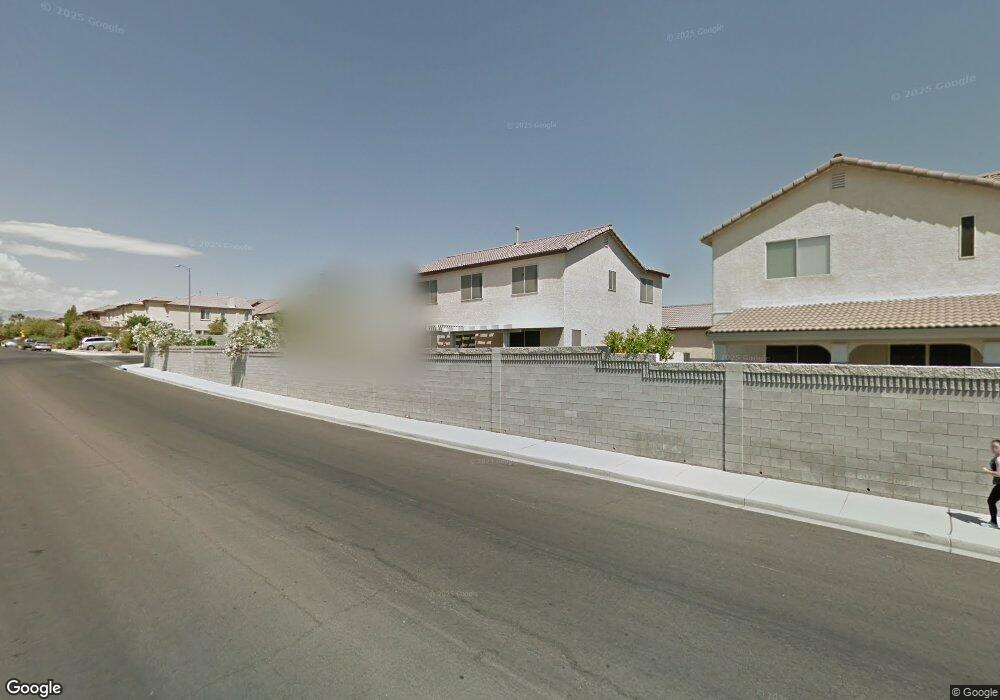
7931 Quail Heaven St Las Vegas, NV 89131
Estimated Value: $482,000 - $512,000
3
Beds
3
Baths
2,060
Sq Ft
$239/Sq Ft
Est. Value
About This Home
This home is located at 7931 Quail Heaven St, Las Vegas, NV 89131 and is currently estimated at $493,191, approximately $239 per square foot. 7931 Quail Heaven St is a home located in Clark County with nearby schools including James Bilbray Elementary School, William & Mary Scherkenbach Elementary School, and Ralph Cadwallader Middle School.
Ownership History
Date
Name
Owned For
Owner Type
Purchase Details
Closed on
Aug 18, 2017
Sold by
Richard Carolyn Arrechea
Bought by
Kio Scott and Kio Amanda
Current Estimated Value
Home Financials for this Owner
Home Financials are based on the most recent Mortgage that was taken out on this home.
Original Mortgage
$296,235
Outstanding Balance
$246,717
Interest Rate
3.89%
Estimated Equity
$246,474
Purchase Details
Closed on
Sep 30, 2011
Sold by
Jpmc Specialty Mortgage Llc
Bought by
Arrechea Richard and Arrechea Carolyn
Purchase Details
Closed on
Apr 19, 2011
Sold by
Sayno Antonette
Bought by
Jpmc Specialty Mortgage Llc
Purchase Details
Closed on
Apr 25, 2002
Sold by
Concordia Quail Run Llc
Bought by
Sayno Antonette
Home Financials for this Owner
Home Financials are based on the most recent Mortgage that was taken out on this home.
Original Mortgage
$141,735
Interest Rate
9.25%
Create a Home Valuation Report for This Property
The Home Valuation Report is an in-depth analysis detailing your home's value as well as a comparison with similar homes in the area
Home Values in the Area
Average Home Value in this Area
Purchase History
| Date | Buyer | Sale Price | Title Company |
|---|---|---|---|
| Kio Scott | $290,000 | -- | |
| Arrechea Richard | $138,000 | Ticor Title Las Vegas | |
| Jpmc Specialty Mortgage Llc | $150,214 | First American National Def | |
| Sayno Antonette | $177,170 | First American Title Co |
Source: Public Records
Mortgage History
| Date | Status | Borrower | Loan Amount |
|---|---|---|---|
| Open | Kio Scott | $296,235 | |
| Closed | Kio Scott | -- | |
| Previous Owner | Sayno Antonette | $141,735 | |
| Closed | Sayno Antonette | $26,575 |
Source: Public Records
Tax History Compared to Growth
Tax History
| Year | Tax Paid | Tax Assessment Tax Assessment Total Assessment is a certain percentage of the fair market value that is determined by local assessors to be the total taxable value of land and additions on the property. | Land | Improvement |
|---|---|---|---|---|
| 2025 | $2,534 | $126,282 | $34,650 | $91,632 |
| 2024 | $2,460 | $126,282 | $34,650 | $91,632 |
| 2023 | $2,460 | $125,099 | $38,850 | $86,249 |
| 2022 | $2,619 | $112,527 | $33,600 | $78,927 |
| 2021 | $2,425 | $101,616 | $26,600 | $75,016 |
| 2020 | $2,249 | $99,859 | $25,550 | $74,309 |
| 2019 | $2,108 | $96,562 | $23,450 | $73,112 |
| 2018 | $2,011 | $89,797 | $19,600 | $70,197 |
| 2017 | $2,953 | $90,080 | $18,900 | $71,180 |
| 2016 | $1,883 | $75,690 | $12,600 | $63,090 |
| 2015 | $1,879 | $65,385 | $11,550 | $53,835 |
| 2014 | $1,824 | $53,980 | $10,500 | $43,480 |
Source: Public Records
Map
Nearby Homes
- 7963 Cape Brett St
- 8335 Martinborough Ave
- 7931 Kelburn Hill St
- 8258 Amtrak Express Ave
- 7821 Bright Heights St
- 8309 Dawn Breeze Ave
- 7936 Quail Cap St
- 8313 Dawn Breeze Ave
- 8277 Orange Vale Ave
- 8240 Aurora Peak Ave
- 8248 Ice Train Ave
- 8121 Rocket St
- 8021 Dancing Springs St
- 7962 Quail Turn St
- 8108 Terracotta Gulf Ct
- 7909 Hollow Pine St Unit 2
- 7948 Quick Pine St
- 8333 Valley Stream Ave
- 8162 Deer Clan Ct
- 8020 Copperhead Creek St
- 7935 Quail Heaven St
- 8269 Quail Arroyo Ave
- 7939 Quail Heaven St
- 8265 Quail Arroyo Ave
- 8303 Martinborough Ave
- 8303 Martinborough Ave
- 8303 Martinborough Ave
- 8304 Jo Marcy Dr
- 7936 Quail Heaven St
- 8261 Quail Arroyo Ave
- 7943 Quail Heaven St
- 8307 Martinborough Ave
- 8307 Martinborough Ave Unit n
- 8307 Martinborough Ave
- 7940 Quail Heaven St
- 8308 Jo Marcy Dr
- 7924 Cape Brett St
- 8311 Martinborough Ave
- 8257 Quail Arroyo Ave
- 8312 Jo Marcy Dr