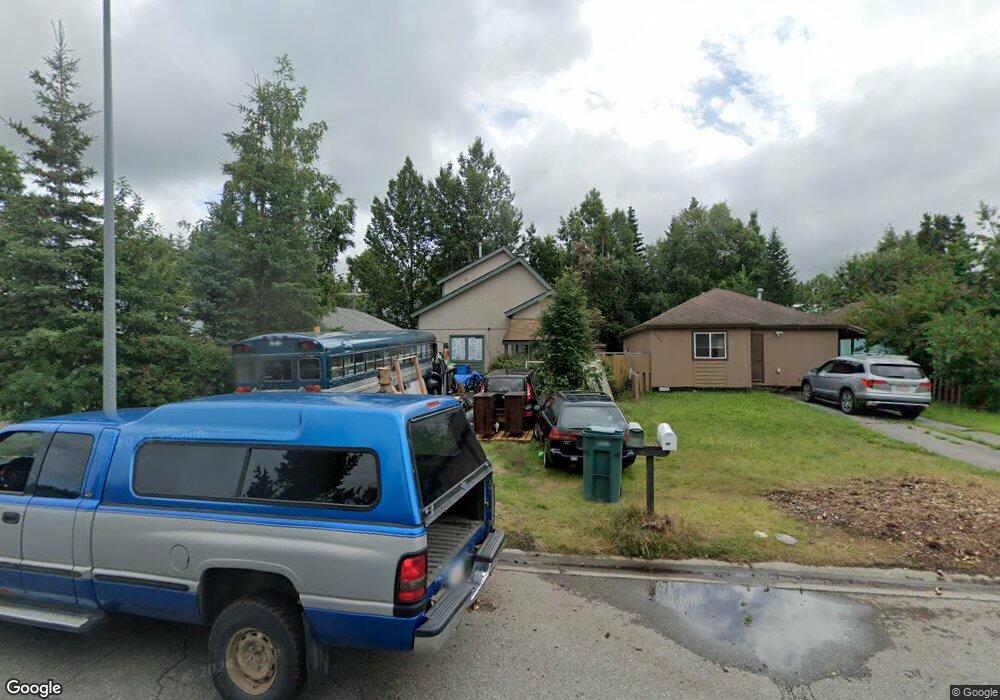
7932 Chaimi Loop Anchorage, AK 99504
Scenic Foothills NeighborhoodEstimated Value: $172,000 - $349,000
3
Beds
2
Baths
1,410
Sq Ft
$212/Sq Ft
Est. Value
About This Home
This home is located at 7932 Chaimi Loop, Anchorage, AK 99504 and is currently estimated at $298,903, approximately $211 per square foot. 7932 Chaimi Loop is a home located in Anchorage Municipality with nearby schools including Scenic Park Elementary School, Nicholas J. Begich Middle School, and Bartlett High School.
Ownership History
Date
Name
Owned For
Owner Type
Purchase Details
Closed on
Jul 20, 2009
Sold by
Conley Heather and Engle Heather
Bought by
Gotthardt Forrest O S and Fox Chanel M
Current Estimated Value
Home Financials for this Owner
Home Financials are based on the most recent Mortgage that was taken out on this home.
Original Mortgage
$196,278
Outstanding Balance
$126,660
Interest Rate
5.25%
Mortgage Type
FHA
Estimated Equity
$172,243
Purchase Details
Closed on
Jun 16, 2008
Sold by
Engle Jason
Bought by
Conley Heather and Engle Heather
Purchase Details
Closed on
Aug 17, 2001
Sold by
Gaudette Troy J and Gaudette Sandra L
Bought by
Engle Jason T and Engle Heather M
Home Financials for this Owner
Home Financials are based on the most recent Mortgage that was taken out on this home.
Original Mortgage
$132,090
Interest Rate
7.19%
Mortgage Type
VA
Purchase Details
Closed on
Aug 16, 2001
Sold by
Gaudette Troy J and Gaudette Sandra L
Bought by
Engle Jason T and Engle Heather M
Home Financials for this Owner
Home Financials are based on the most recent Mortgage that was taken out on this home.
Original Mortgage
$132,090
Interest Rate
7.19%
Mortgage Type
VA
Purchase Details
Closed on
Nov 14, 1994
Sold by
Hunsaker Robert L and Hunsaker Taesun
Bought by
Gaudette Troy J and Gaudette Sandra L
Home Financials for this Owner
Home Financials are based on the most recent Mortgage that was taken out on this home.
Original Mortgage
$89,760
Interest Rate
8.86%
Mortgage Type
VA
Purchase Details
Closed on
Jan 22, 1988
Sold by
Home Savings Bank
Bought by
Hunsaker Robert L and Hunsaker Taesun
Home Financials for this Owner
Home Financials are based on the most recent Mortgage that was taken out on this home.
Original Mortgage
$68,400
Interest Rate
10.75%
Mortgage Type
Seller Take Back
Create a Home Valuation Report for This Property
The Home Valuation Report is an in-depth analysis detailing your home's value as well as a comparison with similar homes in the area
Home Values in the Area
Average Home Value in this Area
Purchase History
| Date | Buyer | Sale Price | Title Company |
|---|---|---|---|
| Gotthardt Forrest O S | -- | Atga | |
| Conley Heather | -- | None Available | |
| Engle Jason T | -- | -- | |
| Engle Jason T | -- | -- | |
| Gaudette Troy J | -- | -- | |
| Gaudette Troy J | -- | -- | |
| Hunsaker Robert L | -- | -- |
Source: Public Records
Mortgage History
| Date | Status | Borrower | Loan Amount |
|---|---|---|---|
| Open | Gotthardt Forrest O S | $196,278 | |
| Previous Owner | Engle Jason T | $132,090 | |
| Previous Owner | Engle Jason T | $132,090 | |
| Previous Owner | Gaudette Troy J | $89,760 | |
| Previous Owner | Hunsaker Robert L | $68,400 |
Source: Public Records
Tax History
| Year | Tax Paid | Tax Assessment Tax Assessment Total Assessment is a certain percentage of the fair market value that is determined by local assessors to be the total taxable value of land and additions on the property. | Land | Improvement |
|---|---|---|---|---|
| 2025 | $3,108 | $301,500 | $84,000 | $217,500 |
| 2024 | $3,108 | $267,500 | $84,000 | $183,500 |
| 2023 | $4,143 | $243,300 | $84,000 | $159,300 |
| 2022 | $3,419 | $253,000 | $84,000 | $169,000 |
| 2021 | $4,004 | $222,200 | $84,000 | $138,200 |
| 2020 | $2,872 | $211,500 | $84,000 | $127,500 |
| 2019 | $2,646 | $202,200 | $84,000 | $118,200 |
| 2018 | $2,910 | $221,800 | $87,700 | $134,100 |
| 2017 | $3,267 | $228,600 | $83,200 | $145,400 |
| 2016 | $2,664 | $219,000 | $83,200 | $135,800 |
| 2015 | $2,664 | $206,300 | $76,000 | $130,300 |
| 2014 | $2,664 | $201,200 | $76,000 | $125,200 |
Source: Public Records
Map
Nearby Homes
- 8050 Pioneer Dr Unit 303
- 7714 Hennings Way
- 3701 James Dr
- 8810 Pioneer Dr
- 3420 Meadowbrook Cir
- 7004 Meteor Ct
- 7031 Baxter Terrace Cir
- 7017 Cape Lisburne Loop
- 8500 Ridgeway Ave
- 6251 E 41st Ct Unit 115
- 6245 E Tudor Rd Unit 16
- 6294 Aldona Cir
- 6237 E 34th Ave
- 7989 Hillshire Ct Unit 39
- 6010 Longoria Cir
- 8041 Astonshire Ct Unit 85
- L1 Whisper Hill Cir
- 3973 Defiance St
- Slm L1 B1
- 2291 Duncanshire Place Unit 154
- 7936 Chaimi Loop
- 7928 Chaimi Loop
- 7940 Chaimi Loop
- 7924 Chaimi Loop
- 7944 Chaimi Loop
- 7920 Chaimi Loop
- 7960 Resurrection Dr
- 7960 Resurrection Dr Unit 6
- 7954 Resurrection Dr
- 7962 Resurrection Dr Unit 5
- 7962 Resurrection Dr
- 7948 Chaimi Loop
- 7916 Chaimi Loop
- 7966 Resurrection Dr Unit 7
- 7966 Resurrection Dr
- 7966 Resurrection Dr Unit 7966
- 7837 Chaimi Loop
- 7950 Resurrection Dr Unit 2
- 7950 Resurrection Dr
- 7804 Regal Mountain Cir
Your Personal Tour Guide
Ask me questions while you tour the home.