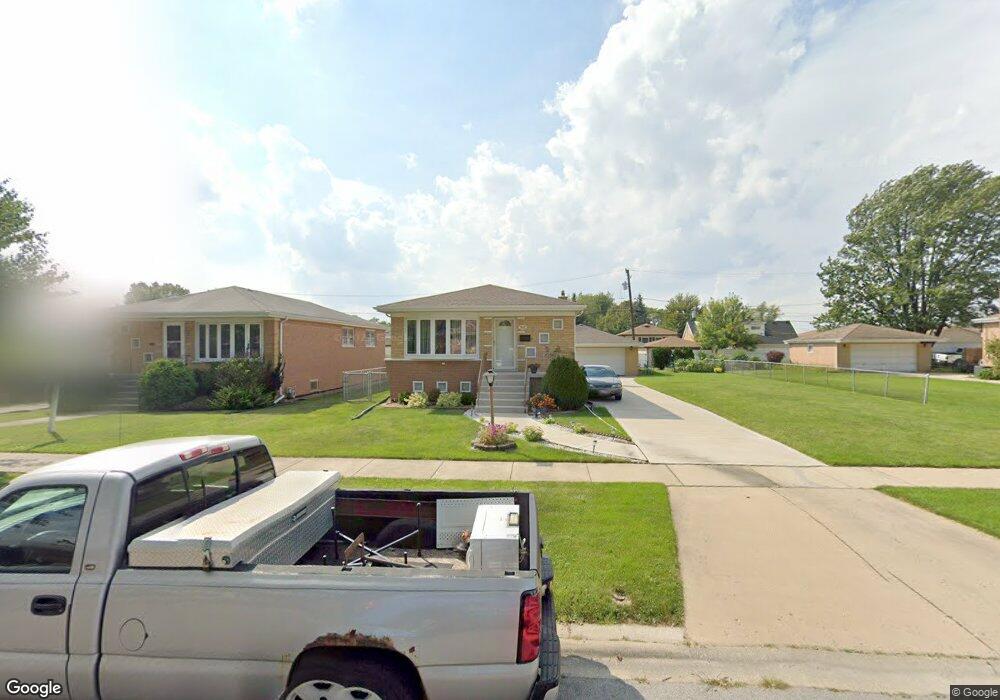
7932 Natchez Ave Burbank, IL 60459
Estimated Value: $332,498 - $381,000
5
Beds
2
Baths
1,200
Sq Ft
$298/Sq Ft
Est. Value
About This Home
This home is located at 7932 Natchez Ave, Burbank, IL 60459 and is currently estimated at $357,875, approximately $298 per square foot. 7932 Natchez Ave is a home located in Cook County with nearby schools including F B Mccord Elementary School, Reavis High School, and St Albert the Great Catholic School.
Ownership History
Date
Name
Owned For
Owner Type
Purchase Details
Closed on
May 15, 2008
Sold by
Wrobel Andrzej
Bought by
Siedlinski Irene and Loy Deborah A
Current Estimated Value
Purchase Details
Closed on
Oct 28, 2005
Sold by
Sarna Jan and Sarna Maria
Bought by
Wrobel Andrzej
Home Financials for this Owner
Home Financials are based on the most recent Mortgage that was taken out on this home.
Original Mortgage
$240,000
Interest Rate
8%
Mortgage Type
Unknown
Purchase Details
Closed on
Dec 18, 2002
Sold by
Bartz Antoinette and Meskinis Antonia
Bought by
Sarna Jan and Sarna Maria
Home Financials for this Owner
Home Financials are based on the most recent Mortgage that was taken out on this home.
Original Mortgage
$165,000
Interest Rate
5.75%
Purchase Details
Closed on
Jun 6, 1994
Sold by
Olesky Helen K
Bought by
Meskinis Antonia and Bartz Antionette
Create a Home Valuation Report for This Property
The Home Valuation Report is an in-depth analysis detailing your home's value as well as a comparison with similar homes in the area
Home Values in the Area
Average Home Value in this Area
Purchase History
| Date | Buyer | Sale Price | Title Company |
|---|---|---|---|
| Siedlinski Irene | $265,000 | Multiple | |
| Wrobel Andrzej | $301,500 | Marquis Title | |
| Sarna Jan | $224,000 | Ticor Title | |
| Meskinis Antonia | $138,000 | -- |
Source: Public Records
Mortgage History
| Date | Status | Borrower | Loan Amount |
|---|---|---|---|
| Previous Owner | Wrobel Andrzej | $240,000 | |
| Previous Owner | Sarna Jan | $165,000 |
Source: Public Records
Tax History Compared to Growth
Tax History
| Year | Tax Paid | Tax Assessment Tax Assessment Total Assessment is a certain percentage of the fair market value that is determined by local assessors to be the total taxable value of land and additions on the property. | Land | Improvement |
|---|---|---|---|---|
| 2024 | $7,349 | $27,001 | $5,843 | $21,158 |
| 2023 | $5,885 | $27,001 | $5,843 | $21,158 |
| 2022 | $5,885 | $18,680 | $5,141 | $13,539 |
| 2021 | $5,664 | $18,680 | $5,141 | $13,539 |
| 2020 | $5,546 | $18,680 | $5,141 | $13,539 |
| 2019 | $4,720 | $16,602 | $4,674 | $11,928 |
| 2018 | $4,583 | $16,602 | $4,674 | $11,928 |
| 2017 | $4,452 | $16,602 | $4,674 | $11,928 |
| 2016 | $4,727 | $15,914 | $3,972 | $11,942 |
| 2015 | $1,848 | $15,914 | $3,972 | $11,942 |
| 2014 | $1,755 | $15,914 | $3,972 | $11,942 |
| 2013 | $1,642 | $18,536 | $3,972 | $14,564 |
Source: Public Records
Map
Nearby Homes
- 8019 Natchez Ave
- 7900 Nagle Ave Unit 3S
- 7900 S Nagle Ave Unit 1S
- 7943 Natoma Ave
- 8646 S Nagle Ave
- 8001 Rutherford Ave
- 7728 Natchez Ave
- 6437 W 82nd St
- 7921 Mobile Ave
- 8138 Mulligan Ave
- 7858 Rutherford Ave Unit 3D
- 7712 Nagle Ave
- 6241 W 80th St
- 7948 Merrimac Ave
- 7721 Normandy Ave
- 8132 Oak Park Ave
- 7912 New Castle Ave
- 6611 W 83rd St
- 6629 W 83rd St
- 7707 Mobile Ave
- 7926 Natchez Ave
- 7938 Natchez Ave
- 7937 S Neenah Ave
- 7933 Neenah Ave
- 7935 Neenah Ave
- 7931 Neenah Ave
- 7937 Neenah Ave
- 7920 Natchez Ave
- 7950 Natchez Ave
- 7923 Neenah Ave
- 7923 Neenah Ave
- 7939 Neenah Ave
- 7941 Neenah Ave
- 7927 Natchez Ave
- 7931 Natchez Ave
- 7921 Neenah Ave
- 7925 Natchez Ave
- 7933 Natchez Ave
- 7949 Neenah Ave
- 7949 Neenah Ave