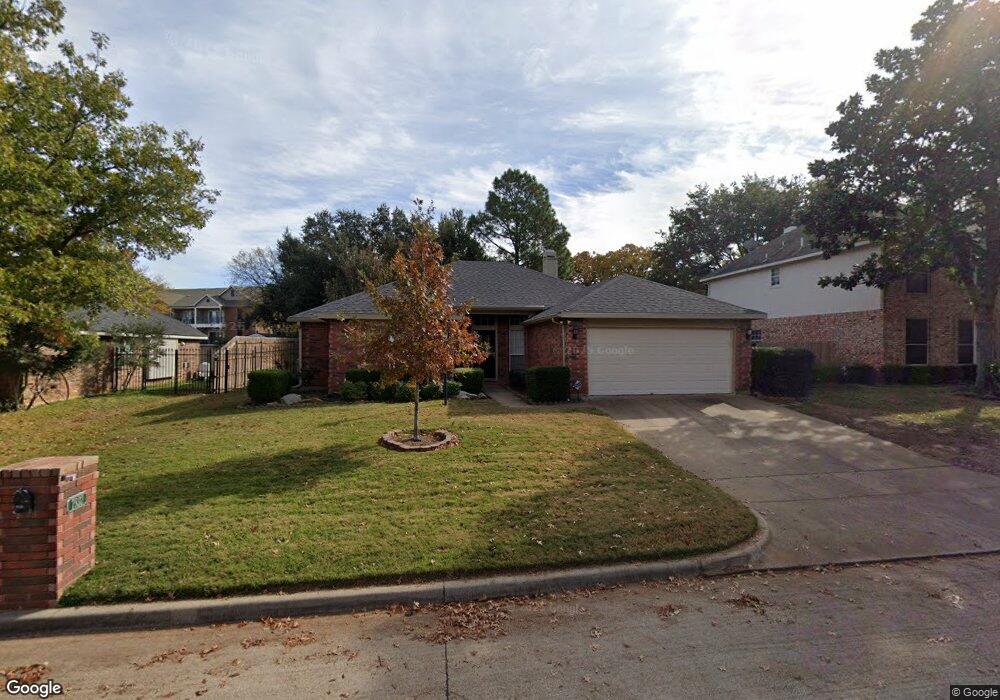
7932 Woodland Dr North Richland Hills, TX 76182
Estimated Value: $365,818 - $415,000
3
Beds
2
Baths
1,745
Sq Ft
$221/Sq Ft
Est. Value
About This Home
This home is located at 7932 Woodland Dr, North Richland Hills, TX 76182 and is currently estimated at $385,455, approximately $220 per square foot. 7932 Woodland Dr is a home located in Tarrant County with nearby schools including Green Valley Elementary School, North Ridge Middle School, and Richland High School.
Ownership History
Date
Name
Owned For
Owner Type
Purchase Details
Closed on
Sep 16, 2011
Sold by
Wakefield Diann K
Bought by
Dupler Daniel L and Dupler Wanda R
Current Estimated Value
Purchase Details
Closed on
Sep 21, 2005
Sold by
Ali Shahid and Bangash Nadia
Bought by
Wakefield Diann K
Home Financials for this Owner
Home Financials are based on the most recent Mortgage that was taken out on this home.
Original Mortgage
$112,400
Interest Rate
7.7%
Mortgage Type
Fannie Mae Freddie Mac
Purchase Details
Closed on
Nov 27, 2000
Sold by
Ocwen Federal Bank Fsb
Bought by
Ali Shahid
Home Financials for this Owner
Home Financials are based on the most recent Mortgage that was taken out on this home.
Original Mortgage
$95,095
Interest Rate
7.72%
Purchase Details
Closed on
Aug 1, 2000
Sold by
Clover Bret Alan and Clover Colleen Wilson
Bought by
Ocwen Federal Bank Fsb
Create a Home Valuation Report for This Property
The Home Valuation Report is an in-depth analysis detailing your home's value as well as a comparison with similar homes in the area
Home Values in the Area
Average Home Value in this Area
Purchase History
| Date | Buyer | Sale Price | Title Company |
|---|---|---|---|
| Dupler Daniel L | -- | Old Republic Title | |
| Wakefield Diann K | -- | Fidelity National Title | |
| Ali Shahid | -- | Allegiance Title Co | |
| Ocwen Federal Bank Fsb | $92,225 | -- |
Source: Public Records
Mortgage History
| Date | Status | Borrower | Loan Amount |
|---|---|---|---|
| Previous Owner | Wakefield Diann K | $112,400 | |
| Previous Owner | Ali Shahid | $95,095 |
Source: Public Records
Tax History Compared to Growth
Tax History
| Year | Tax Paid | Tax Assessment Tax Assessment Total Assessment is a certain percentage of the fair market value that is determined by local assessors to be the total taxable value of land and additions on the property. | Land | Improvement |
|---|---|---|---|---|
| 2025 | $1,299 | $357,385 | $75,000 | $282,385 |
| 2024 | $1,299 | $357,385 | $75,000 | $282,385 |
| 2023 | $7,218 | $359,626 | $75,000 | $284,626 |
| 2022 | $7,198 | $309,415 | $45,000 | $264,415 |
| 2021 | $6,920 | $292,205 | $45,000 | $247,205 |
| 2020 | $6,290 | $259,494 | $45,000 | $214,494 |
| 2019 | $5,918 | $261,143 | $45,000 | $216,143 |
| 2018 | $2,631 | $204,309 | $45,000 | $159,309 |
| 2017 | $4,997 | $228,508 | $45,000 | $183,508 |
| 2016 | $4,543 | $194,283 | $35,000 | $159,283 |
| 2015 | $2,667 | $153,500 | $20,000 | $133,500 |
| 2014 | $2,667 | $153,500 | $20,000 | $133,500 |
Source: Public Records
Map
Nearby Homes
- 7924 Woodland Dr
- 8112 Autumn Run Ln
- 7924 Ember Oaks Dr
- 7901 Forest Point Ct
- 8048 Green Valley Dr
- 8229 Forest Glenn
- 7716 Bridlewood Ct
- 8000 Long Trail Dr
- 8316 Westwind Ln
- 8428 Hidden Creek Ct
- 8417 Patricks Path
- 8324 Flat Rock Ct
- 8200 Thornhill Dr
- 8133 Pecan Ridge Dr
- 8600 Foxwood Dr
- 7404 Forrest Ln
- 8308 Johns Way
- 7716 Evergreen Ave
- 7708 Ridgeway Ct
- 8932 Thornberry Dr
- 7928 Woodland Dr
- 7936 Woodland Dr
- 7940 Woodland Dr
- 8116 Autumn Run Ln
- 7925 Spring Run
- 8121 Fireside Dr
- 8113 Autumn Run Ln
- 7920 Woodland Dr
- 7944 Woodland Dr
- 7929 Spring Run
- 7921 Spring Run
- 8117 Fireside Dr
- 8109 Autumn Run Ln
- 7933 Spring Run
- 7921 Woodland Dr
- 7916 Woodland Dr
- 8128 Fireside Dr
- 8108 Autumn Run Ln
- 7917 Spring Run
- 8124 Fireside Dr