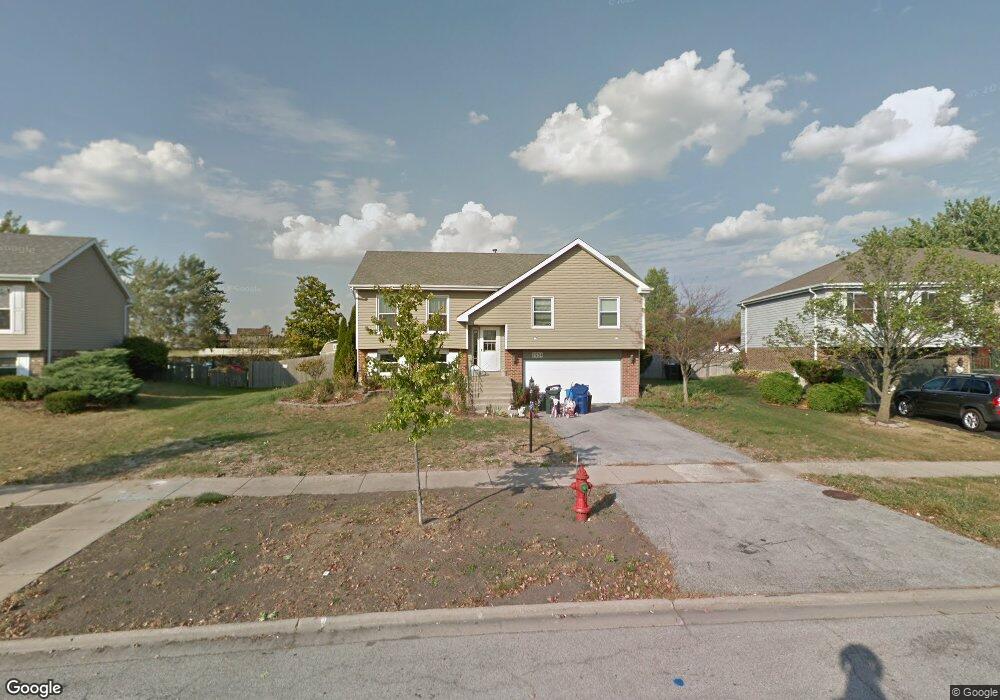
7934 W Frankfort Square Rd Frankfort, IL 60423
Frankfort Square NeighborhoodEstimated Value: $353,000 - $407,000
3
Beds
3
Baths
1,241
Sq Ft
$301/Sq Ft
Est. Value
About This Home
This home is located at 7934 W Frankfort Square Rd, Frankfort, IL 60423 and is currently estimated at $373,592, approximately $301 per square foot. 7934 W Frankfort Square Rd is a home located in Will County with nearby schools including Frankfort Square Elementary School, Summit Hill Junior High School, and Lincoln-Way East High School.
Ownership History
Date
Name
Owned For
Owner Type
Purchase Details
Closed on
Apr 27, 2006
Sold by
Ulcigrai Alan E
Bought by
Reynolds George E
Current Estimated Value
Home Financials for this Owner
Home Financials are based on the most recent Mortgage that was taken out on this home.
Original Mortgage
$247,350
Outstanding Balance
$144,399
Interest Rate
6.54%
Mortgage Type
Fannie Mae Freddie Mac
Estimated Equity
$229,193
Purchase Details
Closed on
Apr 20, 2001
Sold by
Connors Robert E
Bought by
Ulcigrai Alan E
Home Financials for this Owner
Home Financials are based on the most recent Mortgage that was taken out on this home.
Original Mortgage
$154,000
Interest Rate
6.95%
Purchase Details
Closed on
Aug 14, 1996
Sold by
Connors Robert E and Selimos Susan E
Bought by
Connors Robert E
Home Financials for this Owner
Home Financials are based on the most recent Mortgage that was taken out on this home.
Original Mortgage
$126,000
Interest Rate
7.25%
Create a Home Valuation Report for This Property
The Home Valuation Report is an in-depth analysis detailing your home's value as well as a comparison with similar homes in the area
Home Values in the Area
Average Home Value in this Area
Purchase History
| Date | Buyer | Sale Price | Title Company |
|---|---|---|---|
| Reynolds George E | $255,000 | None Available | |
| Ulcigrai Alan E | $166,500 | Chicago Title Insurance Co | |
| Connors Robert E | $18,000 | Chicago Title Insurance Co |
Source: Public Records
Mortgage History
| Date | Status | Borrower | Loan Amount |
|---|---|---|---|
| Open | Reynolds George E | $247,350 | |
| Previous Owner | Ulcigrai Alan E | $154,000 | |
| Previous Owner | Connors Robert E | $126,000 |
Source: Public Records
Tax History Compared to Growth
Tax History
| Year | Tax Paid | Tax Assessment Tax Assessment Total Assessment is a certain percentage of the fair market value that is determined by local assessors to be the total taxable value of land and additions on the property. | Land | Improvement |
|---|---|---|---|---|
| 2024 | $8,543 | $109,285 | $25,219 | $84,066 |
| 2023 | $8,543 | $97,602 | $22,523 | $75,079 |
| 2022 | $7,569 | $88,899 | $20,515 | $68,384 |
| 2021 | $7,089 | $83,169 | $19,193 | $63,976 |
| 2020 | $6,977 | $80,825 | $18,652 | $62,173 |
| 2019 | $6,741 | $78,662 | $18,153 | $60,509 |
| 2018 | $6,490 | $76,400 | $17,631 | $58,769 |
| 2017 | $6,351 | $74,616 | $17,219 | $57,397 |
| 2016 | $6,151 | $72,058 | $16,629 | $55,429 |
| 2015 | $5,925 | $69,520 | $16,043 | $53,477 |
| 2014 | $5,925 | $69,036 | $15,931 | $53,105 |
| 2013 | $5,925 | $69,932 | $16,138 | $53,794 |
Source: Public Records
Map
Nearby Homes
- 8025 Stonegate Dr
- 8131 W Evergreen Dr
- 7959 Brookside Glen Dr Unit VI
- 20027 S Jessica Ln
- 8124 Glenbrook Place Unit 1
- 7905 Richardson Ln
- 7800 W Kingston Dr
- 7758 W Kingston Dr
- 7928 Trinity Cir Unit 2SW
- 7928 Trinity Cir Unit 3NW
- 8026 Bradley Dr
- 20158 S Rosewood Dr
- 8500 Brookside Glen Dr
- 19708 S Skye Dr
- 20137 S Hampton Ct Unit A
- 20130 S Frankfort Square Rd
- 7752 W Almond Ct Unit 135
- 7407 Ridgefield Ln
- 7716 Greenway Blvd Unit 1SW
- 8607 Glenshire St
- 7928 W Frankfort Square Rd
- 7942 W Frankfort Square Rd
- 7950 W Frankfort Square Rd
- 7940 W Carrie Ct
- 7912 W Evan Terrace
- 7945 W Carrie Ct
- 7960 W Frankfort Square Rd
- 7918 W Frankfort Square Rd
- 7941 W Carrie Ct
- 7936 W Carrie Ct
- 7917 W Frankfort Square Rd
- 7900 W Evan Terrace Unit 1
- 7901 W Evan Terrace
- 7937 W Carrie Ct
- 7909 W Frankfort Square Rd
- 7930 W Carrie Ct
- 7933 W Carrie Ct Unit 1
- 7858 W Evan Terrace
- 7859 W Evan Terrace
- 7860 W Frankfort Square Rd