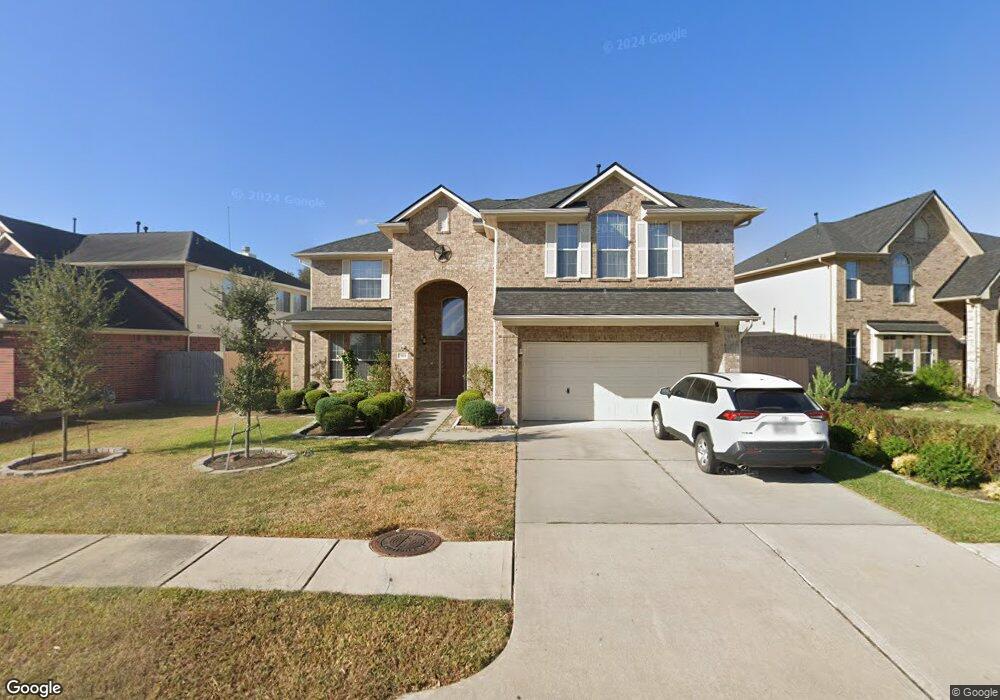
7935 Redland Woods Dr Houston, TX 77040
North Houston NeighborhoodEstimated Value: $359,015 - $364,000
4
Beds
3
Baths
2,842
Sq Ft
$127/Sq Ft
Est. Value
About This Home
This home is located at 7935 Redland Woods Dr, Houston, TX 77040 and is currently estimated at $361,504, approximately $127 per square foot. 7935 Redland Woods Dr is a home located in Harris County with nearby schools including Reed Elementary School, Dean Middle School, and Jersey Village High School.
Ownership History
Date
Name
Owned For
Owner Type
Purchase Details
Closed on
Sep 1, 2020
Sold by
Nguyen Antique V
Bought by
Le Tam Hung and Le Marie Hue
Current Estimated Value
Home Financials for this Owner
Home Financials are based on the most recent Mortgage that was taken out on this home.
Original Mortgage
$143,000
Interest Rate
2.8%
Mortgage Type
New Conventional
Purchase Details
Closed on
Sep 12, 2014
Sold by
Parvizi Hamid and Moghadam Shirin Mohamadi
Bought by
Nguyen Antique V
Home Financials for this Owner
Home Financials are based on the most recent Mortgage that was taken out on this home.
Original Mortgage
$156,000
Interest Rate
4.18%
Mortgage Type
New Conventional
Purchase Details
Closed on
May 18, 2006
Sold by
Morrison Homes Of Texas Inc
Bought by
Parvizi Hamid
Home Financials for this Owner
Home Financials are based on the most recent Mortgage that was taken out on this home.
Original Mortgage
$177,000
Interest Rate
6.5%
Mortgage Type
Fannie Mae Freddie Mac
Create a Home Valuation Report for This Property
The Home Valuation Report is an in-depth analysis detailing your home's value as well as a comparison with similar homes in the area
Home Values in the Area
Average Home Value in this Area
Purchase History
| Date | Buyer | Sale Price | Title Company |
|---|---|---|---|
| Le Tam Hung | -- | None Listed On Document | |
| Nguyen Antique V | -- | None Available | |
| Parvizi Hamid | -- | Mfs Title Of Texas Lp |
Source: Public Records
Mortgage History
| Date | Status | Borrower | Loan Amount |
|---|---|---|---|
| Previous Owner | Le Tam Hung | $143,000 | |
| Previous Owner | Nguyen Antique V | $156,000 | |
| Previous Owner | Parvizi Hamid | $177,000 |
Source: Public Records
Tax History Compared to Growth
Tax History
| Year | Tax Paid | Tax Assessment Tax Assessment Total Assessment is a certain percentage of the fair market value that is determined by local assessors to be the total taxable value of land and additions on the property. | Land | Improvement |
|---|---|---|---|---|
| 2025 | $3,197 | $340,000 | $54,739 | $285,261 |
| 2024 | $3,197 | $362,005 | $54,739 | $307,266 |
| 2023 | $3,197 | $350,000 | $54,739 | $295,261 |
| 2022 | $9,072 | $335,000 | $49,881 | $285,119 |
| 2021 | $7,555 | $265,000 | $49,881 | $215,119 |
| 2020 | $7,336 | $250,000 | $35,629 | $214,371 |
| 2019 | $7,377 | $243,000 | $33,038 | $209,962 |
| 2018 | $3,398 | $236,000 | $33,038 | $202,962 |
| 2017 | $7,520 | $252,434 | $33,038 | $219,396 |
| 2016 | $7,201 | $226,000 | $33,038 | $192,962 |
| 2015 | $6,619 | $232,286 | $33,038 | $199,248 |
| 2014 | $6,619 | $193,320 | $33,038 | $160,282 |
Source: Public Records
Map
Nearby Homes
- 8202 Terrace Brook Dr
- 8115 Oahu Ct
- 8315 Whisper Point Dr
- 8315 Terrace Brook Dr
- 8403 Cienna Dr
- 7915 Corrian Park Cir
- 7926 Westington Ln
- 8418 Westnut Ln
- 8006 Summer Trail Dr
- 7823 Redlands Dr
- 8331 Westbank Ave
- 10515 Ince Ln
- 6508 Redcliff Rd
- 7706 Cloverlake Ct
- 7911 Bova Rd
- 8406 Daycoach Ln
- 8603 Little River Rd
- 8126 Ivan Reid Dr
- 7802 Percussion Place
- 8111 Ivan Reid Dr
- 7931 Redland Woods Dr
- 7939 Redland Woods Dr
- 7935 Crystal Moon Dr
- 7943 Redland Woods Dr
- 7923 Redland Woods Dr
- 7931 Crystal Moon Dr
- 7947 Redland Woods Dr
- 7919 Redland Woods Dr
- 7918 Crystal Moon Dr
- 8207 Whisper Point Dr
- 7927 Crystal Moon Dr
- 7915 Redland Woods Dr
- 8211 Whisper Point Dr
- 7951 Redland Woods Dr
- 7946 Redland Woods Dr
- 7914 Crystal Moon Dr
- 8215 Whisper Point Dr
- 7923 Crystal Moon Dr
- 7911 Redland Woods Dr
- 7950 Redland Woods Dr