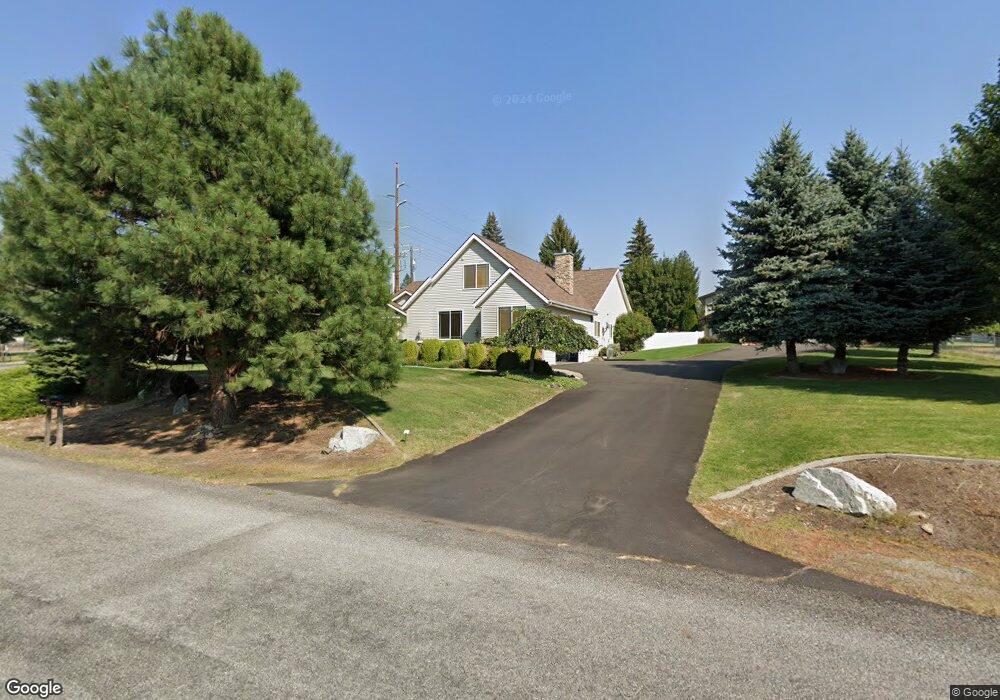
7936 N Colfax St Dalton Gardens, ID 83815
Estimated Value: $1,010,000 - $1,373,000
4
Beds
5
Baths
3,794
Sq Ft
$316/Sq Ft
Est. Value
About This Home
This home is located at 7936 N Colfax St, Dalton Gardens, ID 83815 and is currently estimated at $1,200,238, approximately $316 per square foot. 7936 N Colfax St is a home with nearby schools including Dalton Elementary School, Canfield Middle School, and Coeur d'Alene High School.
Ownership History
Date
Name
Owned For
Owner Type
Purchase Details
Closed on
Aug 13, 2024
Sold by
Davis James R
Bought by
James Davis Living Trust and Davis
Current Estimated Value
Purchase Details
Closed on
Mar 2, 2015
Sold by
Mccracken Brooks L and Mccracken Andrea
Bought by
Davis James R
Purchase Details
Closed on
Mar 15, 2005
Sold by
English James M and English Gail D
Bought by
Barker Robin D and Barker Christie L
Home Financials for this Owner
Home Financials are based on the most recent Mortgage that was taken out on this home.
Original Mortgage
$359,100
Interest Rate
3.5%
Mortgage Type
Adjustable Rate Mortgage/ARM
Purchase Details
Closed on
Mar 9, 2005
Sold by
Momerak William E
Bought by
Momerak William E and Hime Alesa H
Home Financials for this Owner
Home Financials are based on the most recent Mortgage that was taken out on this home.
Original Mortgage
$359,100
Interest Rate
3.5%
Mortgage Type
Adjustable Rate Mortgage/ARM
Create a Home Valuation Report for This Property
The Home Valuation Report is an in-depth analysis detailing your home's value as well as a comparison with similar homes in the area
Home Values in the Area
Average Home Value in this Area
Purchase History
| Date | Buyer | Sale Price | Title Company |
|---|---|---|---|
| James Davis Living Trust | -- | None Listed On Document | |
| Davis James R | -- | Pioneer Title Co | |
| Barker Robin D | -- | -- | |
| Momerak William E | -- | None Available |
Source: Public Records
Mortgage History
| Date | Status | Borrower | Loan Amount |
|---|---|---|---|
| Previous Owner | Barker Robin D | $359,100 | |
| Previous Owner | Momerak William E | $268,850 |
Source: Public Records
Tax History Compared to Growth
Tax History
| Year | Tax Paid | Tax Assessment Tax Assessment Total Assessment is a certain percentage of the fair market value that is determined by local assessors to be the total taxable value of land and additions on the property. | Land | Improvement |
|---|---|---|---|---|
| 2025 | $4,058 | $1,122,948 | $315,000 | $807,948 |
| 2024 | $4,058 | $1,142,266 | $315,000 | $827,266 |
| 2023 | $4,058 | $1,232,451 | $337,500 | $894,951 |
| 2022 | $5,001 | $1,277,577 | $337,500 | $940,077 |
| 2021 | $4,495 | $757,760 | $225,000 | $532,760 |
| 2020 | $4,378 | $655,260 | $180,000 | $475,260 |
| 2019 | $4,421 | $617,550 | $165,600 | $451,950 |
| 2018 | $4,421 | $563,890 | $144,000 | $419,890 |
| 2017 | $4,312 | $526,820 | $122,850 | $403,970 |
| 2016 | $4,267 | $504,590 | $117,000 | $387,590 |
| 2015 | $4,286 | $489,906 | $103,536 | $386,370 |
| 2013 | $4,133 | $441,185 | $83,835 | $357,350 |
Source: Public Records
Map
Nearby Homes
- 8204 N Ridgewood Dr Unit 6
- 494 E Parkside Dr
- 7959 N Valley St
- 8318 N Village Dr Unit 2
- 8351 N Audubon Dr
- 769 E Southwood Ct
- 8562 N Audubon Dr
- 8323 N Tartan Dr
- 8419 N Cloverleaf Dr
- 7376 N 4th St
- 8776 N Wayne Dr
- 985 E Loch Lomond Ct
- 8698 N Woodvine Dr
- 1280 Glenmore Ct
- 536 E Cloverleaf Dr
- 8385 N Selkirk Ct
- 8393 N Cloverleaf Dr
- 623 E Maple Place
- 7647 N 15th St
- 7728 N 15th St
- 701 E Prairie Ave
- 7991 N 4th St
- 8091 N 4th St
- 7927 N 4th St
- 764 E Prairie Ave
- 564 E Prairie Ave
- 7919 N Colfax St
- 705 E Prairie Ave
- 702 E Prairie Ave
- 7887 N 4th St
- 7848 N 4th St North Lot
- 8010 N
- 7871 N Colfax St
- 7887 N Baillie St
- 0 Loch Haven Dr
- 8010 N Loch Haven Dr
- 8010 Loch Haven Dr
- 7855 N 4th St
- 7848 N 4th St
- 7807 N 4th St