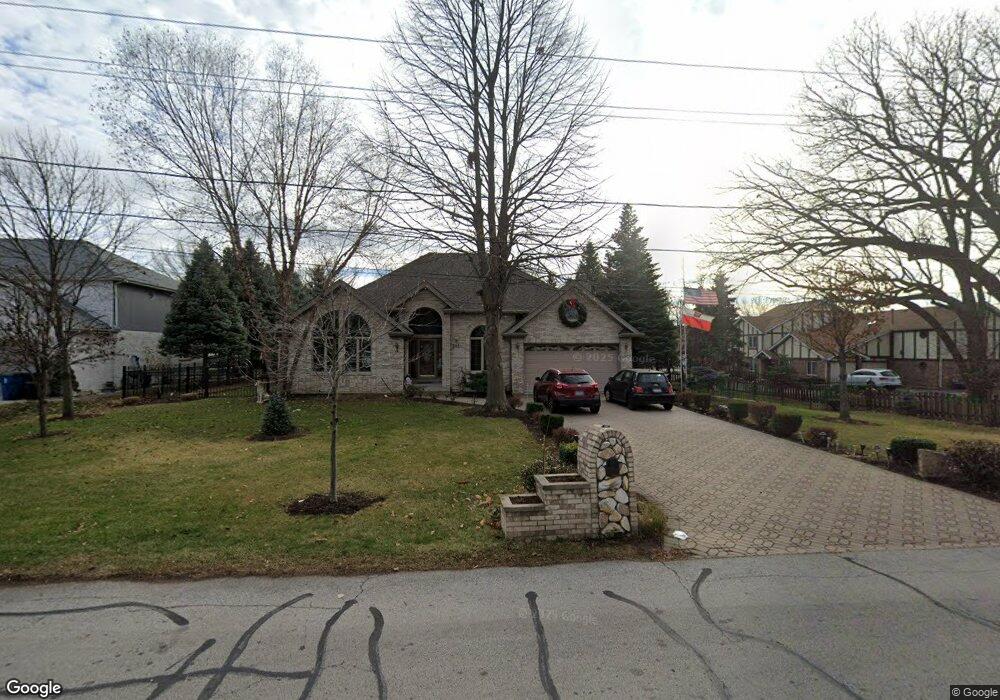
7937 W 107th St Unit 7937A Palos Hills, IL 60465
Estimated Value: $239,566 - $285,000
2
Beds
2
Baths
8,610
Sq Ft
$30/Sq Ft
Est. Value
About This Home
This home is located at 7937 W 107th St Unit 7937A, Palos Hills, IL 60465 and is currently estimated at $257,392, approximately $29 per square foot. 7937 W 107th St Unit 7937A is a home located in Cook County with nearby schools including Palos East Elementary School, Palos South Middle School, and Amos Alonzo Stagg High School.
Ownership History
Date
Name
Owned For
Owner Type
Purchase Details
Closed on
Apr 5, 2021
Sold by
Dubrowska Anna
Bought by
Marquette Bank and Trust Number 30647
Current Estimated Value
Purchase Details
Closed on
Jul 23, 2020
Sold by
Malyszko Jeffrey G
Bought by
Dubrowska Anna
Home Financials for this Owner
Home Financials are based on the most recent Mortgage that was taken out on this home.
Original Mortgage
$131,250
Interest Rate
2.9%
Mortgage Type
New Conventional
Purchase Details
Closed on
Dec 10, 2013
Sold by
De Lennon Thomas and De Florence M Oneill Revocable
Bought by
Malyszko Jeffery G
Home Financials for this Owner
Home Financials are based on the most recent Mortgage that was taken out on this home.
Original Mortgage
$89,250
Interest Rate
4.62%
Mortgage Type
New Conventional
Purchase Details
Closed on
Mar 23, 1994
Sold by
Oneill Florence
Bought by
Oneill Florence M
Create a Home Valuation Report for This Property
The Home Valuation Report is an in-depth analysis detailing your home's value as well as a comparison with similar homes in the area
Home Values in the Area
Average Home Value in this Area
Purchase History
| Date | Buyer | Sale Price | Title Company |
|---|---|---|---|
| Marquette Bank | -- | Attorney | |
| Dubrowska Anna | $175,000 | Citywide Title Corporation | |
| Malyszko Jeffery G | $105,000 | Affinity Title Svcs Llc | |
| Oneill Florence M | -- | -- |
Source: Public Records
Mortgage History
| Date | Status | Borrower | Loan Amount |
|---|---|---|---|
| Previous Owner | Dubrowska Anna | $131,250 | |
| Previous Owner | Malyszko Jeffery G | $89,250 |
Source: Public Records
Tax History Compared to Growth
Tax History
| Year | Tax Paid | Tax Assessment Tax Assessment Total Assessment is a certain percentage of the fair market value that is determined by local assessors to be the total taxable value of land and additions on the property. | Land | Improvement |
|---|---|---|---|---|
| 2024 | $1,632 | $17,510 | $3,492 | $14,018 |
| 2023 | $1,881 | $17,510 | $3,492 | $14,018 |
| 2022 | $1,881 | $12,890 | $3,928 | $8,962 |
| 2021 | $3,739 | $12,889 | $3,928 | $8,961 |
| 2020 | $2,044 | $12,889 | $3,928 | $8,961 |
| 2019 | $3,370 | $12,347 | $3,600 | $8,747 |
| 2018 | $3,207 | $12,347 | $3,600 | $8,747 |
| 2017 | $3,122 | $12,347 | $3,600 | $8,747 |
| 2016 | $3,055 | $11,177 | $3,164 | $8,013 |
| 2015 | $3,019 | $11,177 | $3,164 | $8,013 |
| 2014 | $2,983 | $11,177 | $3,164 | $8,013 |
| 2013 | $2,726 | $13,559 | $3,164 | $10,395 |
Source: Public Records
Map
Nearby Homes
- 10820 Kathleen Ct Unit D
- 10531 S Roberts Rd Unit 2D
- 10926 Circle Ct
- 10927 Circle Dr
- 8057 Valley Dr
- 11050 S Roberts Rd
- 10832 S 76th Ave Unit 3J
- 11001 Stony Creek Dr Unit 2C
- 7801 W 111th St
- 3 Stony Creek Dr Unit A
- 6 W Pebble Ct Unit A
- 8202 Gruener Ct
- 10441 S 83rd Ave
- 10845 S 84th Ave Unit 2B
- 10324 S 81st Ave
- 10440 S 75th Ct
- 11195 S Roberts Rd
- 11015 S 84th Ave Unit 3C
- 10300 S Kathy Ct
- 10562 S 84th Ave
- 7937 W 107th St Unit A
- 7937 W 107th St Unit 7937D
- 7937 W 107th St Unit 7937B
- 7937 W 107th St Unit 7937C
- 7937 W 107th St Unit B
- 7937 W 107th St Unit D
- 7937 W 107th St Unit C
- 7935 W 107th St Unit C
- 7935 W 107th St Unit 7935D
- 7935 W 107th St Unit 7935A
- 7935 W 107th St Unit 7935C
- 7935 W 107th St Unit 7935B
- 7935 W 107th St Unit A
- 7935 W 107th St Unit B
- 7939 W 107th St Unit 7939C
- 7939 W 107th St Unit 7939D
- 7939 W 107th St Unit 7939B
- 7939 W 107th St Unit 7939A
- 7910 W 108th St
- 7908 W 108th St