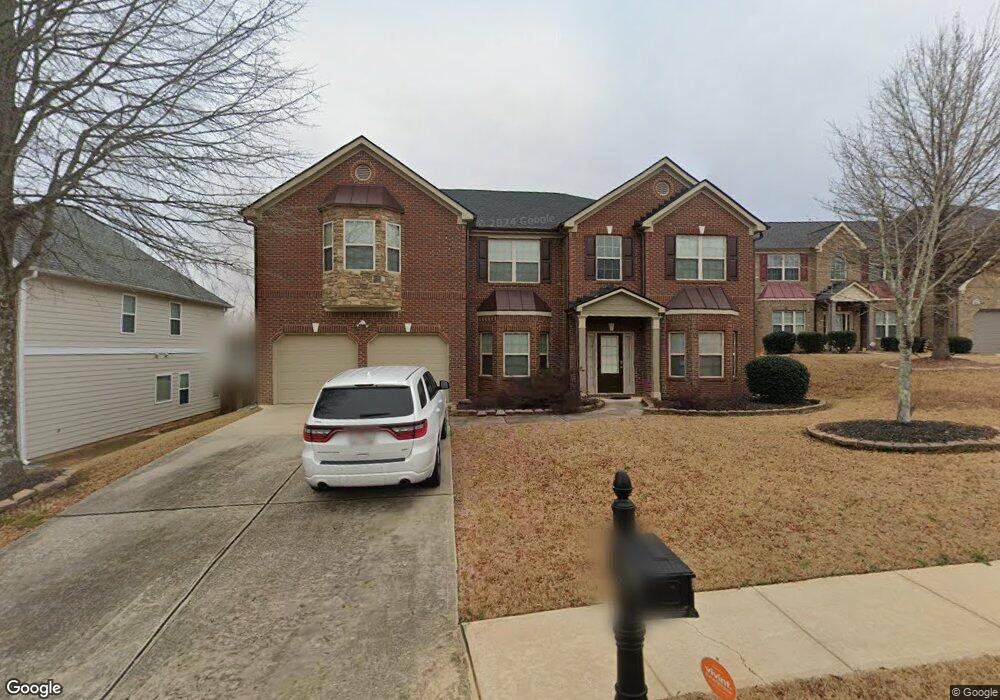
7938 Hawks Nest Trail Unit 322 Lithia Springs, GA 30122
Lithia Springs NeighborhoodEstimated Value: $447,770 - $511,000
4
Beds
3
Baths
4,064
Sq Ft
$119/Sq Ft
Est. Value
About This Home
This home is located at 7938 Hawks Nest Trail Unit 322, Lithia Springs, GA 30122 and is currently estimated at $482,943, approximately $118 per square foot. 7938 Hawks Nest Trail Unit 322 is a home located in Douglas County with nearby schools including Sweetwater Elementary School, Factory Shoals Middle School, and Lithia Springs Comprehensive High School.
Ownership History
Date
Name
Owned For
Owner Type
Purchase Details
Closed on
Mar 25, 2015
Sold by
Canda Edgar G
Bought by
Guest Christopher K
Current Estimated Value
Home Financials for this Owner
Home Financials are based on the most recent Mortgage that was taken out on this home.
Original Mortgage
$192,000
Outstanding Balance
$148,184
Interest Rate
3.89%
Mortgage Type
New Conventional
Estimated Equity
$334,759
Purchase Details
Closed on
Sep 18, 2008
Sold by
Silver Creek Communities Inc
Bought by
Canda Edgar G and Canda Amelia S
Home Financials for this Owner
Home Financials are based on the most recent Mortgage that was taken out on this home.
Original Mortgage
$245,200
Interest Rate
6.36%
Mortgage Type
FHA
Create a Home Valuation Report for This Property
The Home Valuation Report is an in-depth analysis detailing your home's value as well as a comparison with similar homes in the area
Home Values in the Area
Average Home Value in this Area
Purchase History
| Date | Buyer | Sale Price | Title Company |
|---|---|---|---|
| Guest Christopher K | $240,000 | -- | |
| Canda Edgar G | $248,700 | -- |
Source: Public Records
Mortgage History
| Date | Status | Borrower | Loan Amount |
|---|---|---|---|
| Open | Guest Christopher K | $192,000 | |
| Previous Owner | Canda Edgar G | $245,200 |
Source: Public Records
Tax History Compared to Growth
Tax History
| Year | Tax Paid | Tax Assessment Tax Assessment Total Assessment is a certain percentage of the fair market value that is determined by local assessors to be the total taxable value of land and additions on the property. | Land | Improvement |
|---|---|---|---|---|
| 2024 | $6,507 | $156,560 | $24,200 | $132,360 |
| 2023 | $6,507 | $156,560 | $24,200 | $132,360 |
| 2022 | $5,366 | $132,280 | $22,000 | $110,280 |
| 2021 | $4,770 | $117,120 | $19,120 | $98,000 |
| 2020 | $4,609 | $111,080 | $16,440 | $94,640 |
| 2019 | $4,217 | $107,320 | $16,440 | $90,880 |
| 2018 | $4,287 | $108,360 | $17,040 | $91,320 |
| 2017 | $3,939 | $98,520 | $17,240 | $81,280 |
| 2016 | $3,899 | $95,800 | $17,440 | $78,360 |
| 2015 | $3,293 | $89,200 | $16,640 | $72,560 |
| 2014 | $3,293 | $80,200 | $16,040 | $64,160 |
| 2013 | -- | $80,200 | $16,040 | $64,160 |
Source: Public Records
Map
Nearby Homes
- 8816 Sibella Ct
- 2436 Falls River Dr
- 1535 Olde Oak Dr
- 1774 Trail Creek Dr
- 1815 Lee Rd
- 2182 Ann Ln
- 0 W Lake Vulcan Dr Unit 10587241
- 0 Vulcan Dr Unit 10471332
- 0 Vulcan Dr Unit 7530603
- 2623 Jordan Ln
- 2693 Jordan Ln
- 2683 Jordan Ln
- 1940 Lee
- 2499 Chestnut Log Loop
- 3570 Briar Dr
- 3686 Sweetbriar Cir
- 3652 Sweetbriar Cir
- 7315 Lee Rd
- 3646 Briar Dr
- 3790 Sweetbriar Cir
- 7938 Hawks Nest Trail
- 3443 Windmark Place
- 7942 Hawks Nest Trail
- 7934 Hawks Nest Trail
- 7974 Granmore Ct
- 7946 Hawks Nest Trail
- 7935 Hawks Nest Trail
- 7973 Granmore Ct
- 3475 Summerlin Pkwy Unit 293
- 7939 Hawks Nest Trail
- 7978 Granmore Ct
- 7950 Hawks Nest Trail
- 7943 Hawks Nest Trail
- 3479 Summerlin Pkwy
- 3479 Summerlin Pkwy Unit 292
- 7977 Granmore Ct
- 3519 Summerlin Pkwy
- 3517 Summerlin Pkwy
- 7981 Granmore Ct
- 7947 Hawks Nest Trail