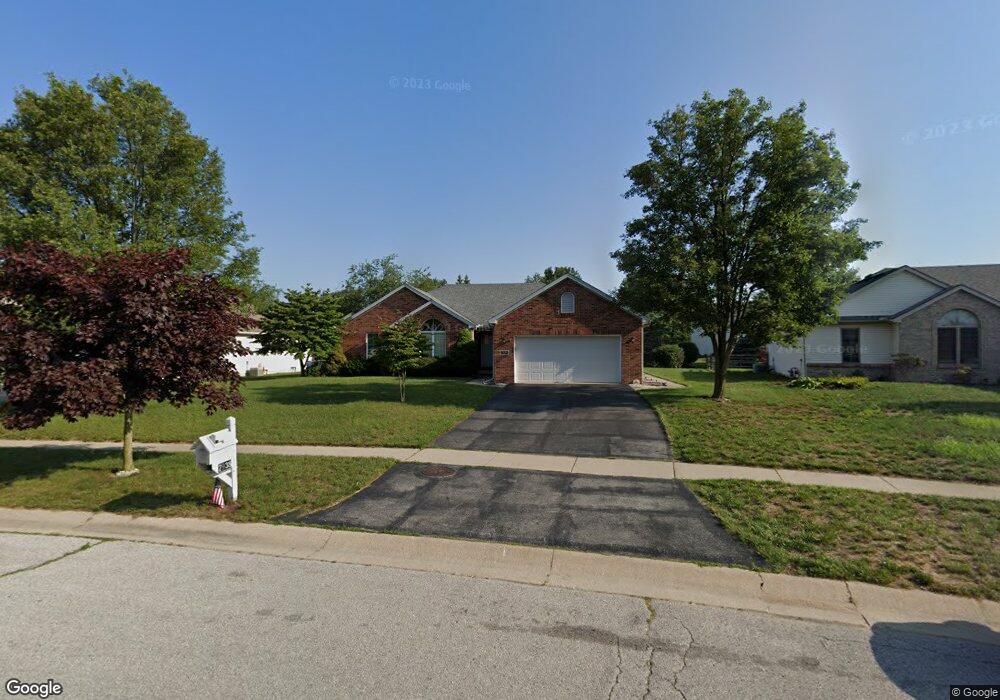
7938 Hidden View Holland, OH 43528
Estimated Value: $220,000 - $330,000
3
Beds
2
Baths
1,796
Sq Ft
$164/Sq Ft
Est. Value
About This Home
This home is located at 7938 Hidden View, Holland, OH 43528 and is currently estimated at $294,650, approximately $164 per square foot. 7938 Hidden View is a home with nearby schools including Dorr Street Elementary School, Springfield Middle School, and Springfield High School.
Ownership History
Date
Name
Owned For
Owner Type
Purchase Details
Closed on
Oct 23, 2023
Sold by
Kurth Irrevocable Gifting Trust
Bought by
Yeager Catherine S
Current Estimated Value
Home Financials for this Owner
Home Financials are based on the most recent Mortgage that was taken out on this home.
Original Mortgage
$160,000
Outstanding Balance
$156,889
Interest Rate
7.18%
Mortgage Type
New Conventional
Estimated Equity
$137,761
Purchase Details
Closed on
Oct 23, 2020
Sold by
Kurth Howard F
Bought by
Kurth Barbara J and Kurth Gigting Irrevocable Trus
Purchase Details
Closed on
Oct 15, 2007
Sold by
Kurth Howard F and Kurth Dorothy C
Bought by
Kurth Howard F and Kurth Dorothy C
Purchase Details
Closed on
Jun 14, 2000
Sold by
Louisville Title Agency Of Nw Ohio Inc
Bought by
Kurth Howard F and Kurth Dorothy C
Create a Home Valuation Report for This Property
The Home Valuation Report is an in-depth analysis detailing your home's value as well as a comparison with similar homes in the area
Home Values in the Area
Average Home Value in this Area
Purchase History
| Date | Buyer | Sale Price | Title Company |
|---|---|---|---|
| Yeager Catherine S | $225,000 | None Listed On Document | |
| Kurth Barbara J | -- | None Available | |
| Kurth Howard F | -- | None Available | |
| Kurth Howard F | -- | Attorney | |
| Kurth Howard F | $185,600 | Louisville Title Agency For |
Source: Public Records
Mortgage History
| Date | Status | Borrower | Loan Amount |
|---|---|---|---|
| Open | Yeager Catherine S | $160,000 |
Source: Public Records
Tax History Compared to Growth
Tax History
| Year | Tax Paid | Tax Assessment Tax Assessment Total Assessment is a certain percentage of the fair market value that is determined by local assessors to be the total taxable value of land and additions on the property. | Land | Improvement |
|---|---|---|---|---|
| 2024 | $2,558 | $81,550 | $19,670 | $61,880 |
| 2023 | $4,845 | $67,305 | $15,785 | $51,520 |
| 2022 | $4,841 | $67,305 | $15,785 | $51,520 |
| 2021 | $3,903 | $67,305 | $15,785 | $51,520 |
| 2020 | $4,030 | $63,700 | $13,650 | $50,050 |
| 2019 | $3,938 | $63,700 | $13,650 | $50,050 |
| 2018 | $4,013 | $63,700 | $13,650 | $50,050 |
| 2017 | $4,109 | $62,230 | $13,335 | $48,895 |
| 2016 | $4,145 | $177,800 | $38,100 | $139,700 |
| 2015 | $4,138 | $177,800 | $38,100 | $139,700 |
| 2014 | $3,584 | $59,820 | $12,810 | $47,010 |
| 2013 | $3,584 | $59,820 | $12,810 | $47,010 |
Source: Public Records
Map
Nearby Homes
- 7909 Hill Ave
- 68 Hidden Meadow Dr
- 7944 Hill Ave
- 8006 Cove Harbour Dr N
- 8046 Lea Ct
- 7709 Fountain Dr
- 7920 N Shoreline Dr
- 215 Stone Oak Ct
- 44 Treetop Place
- 8435 Willow Glen Ct
- 8553 Stone Oak Dr
- 540 S Centennial Rd
- 612 S Centennial Rd
- 134 Deerfield Dr
- 8617 Ponte Vedra Ct
- 7238 Lilac Ct
- 7256 Apache Trail
- 8670 Augusta Ln
- 7331 Witherby Ct
- 7 Tremore Way
- 7930 Hidden View
- 7930 Hidden View Dr
- 100 Longmeadow Dr
- 7954 Hidden View
- 58 Longmeadow Dr
- 7922 Hidden View
- 7933 Hidden View
- 108 Longmeadow Dr
- 7941 Hidden View
- 7966 Hidden View
- 7925 Hidden View
- 50 Longmeadow Dr
- 7949 Hidden View
- 116 Longmeadow Dr
- 7957 Hidden View
- 7917 Hidden View
- 168 Longmeadow Dr
- 125 Hidden Meadow Dr
- 117 Hidden Meadow Dr
- 124 Longmeadow Dr