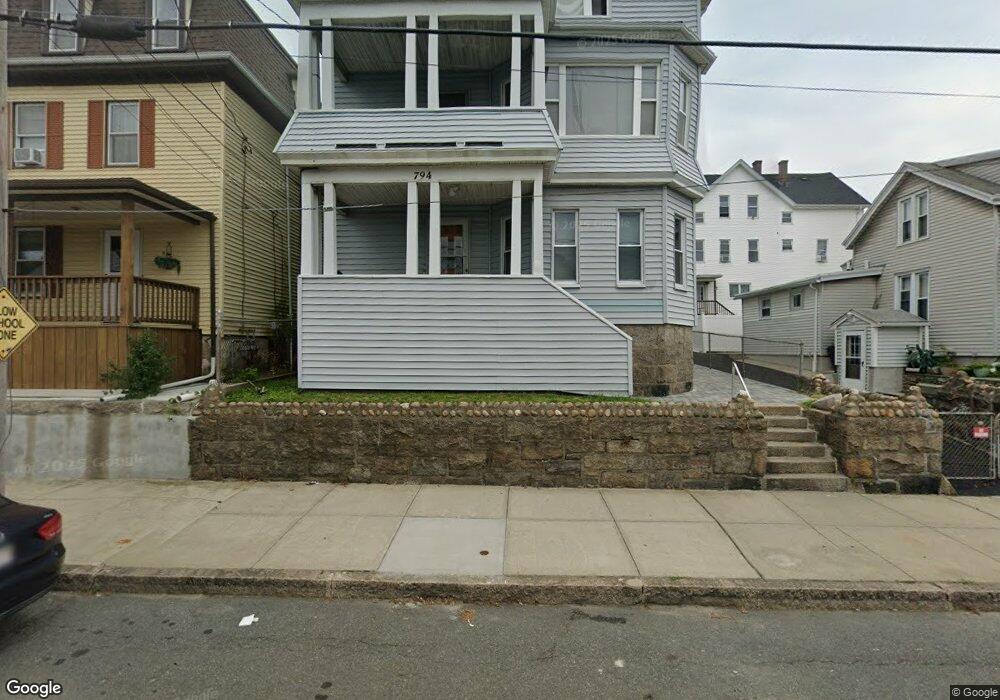
794 Broadway Unit 2 Fall River, MA 02724
Father Kelly NeighborhoodEstimated Value: $359,104 - $655,000
2
Beds
1
Bath
850
Sq Ft
$636/Sq Ft
Est. Value
About This Home
This home is located at 794 Broadway Unit 2, Fall River, MA 02724 and is currently estimated at $540,276, approximately $635 per square foot. 794 Broadway Unit 2 is a home located in Bristol County with nearby schools including Carlton M. Viveiros Elementary School, Matthew J. Kuss Middle School, and B M C Durfee High School.
Ownership History
Date
Name
Owned For
Owner Type
Purchase Details
Closed on
Nov 22, 1999
Sold by
Daponte Joaquim and Daponte Virginia
Bought by
Dangelo Peter J
Current Estimated Value
Purchase Details
Closed on
Nov 2, 1992
Sold by
Dime Sb Ny Fsb
Bought by
Daponte Joaquim and Daponte Viriginia
Purchase Details
Closed on
Mar 13, 1992
Sold by
Paiva Joao M
Bought by
Dime Sb Of Ny Fsb
Purchase Details
Closed on
Jan 25, 1989
Sold by
Sancehz Philip J
Bought by
Paiva Joao M
Purchase Details
Closed on
Jan 5, 1988
Sold by
Borges Augusto R
Bought by
Sanchez Philip
Create a Home Valuation Report for This Property
The Home Valuation Report is an in-depth analysis detailing your home's value as well as a comparison with similar homes in the area
Home Values in the Area
Average Home Value in this Area
Purchase History
| Date | Buyer | Sale Price | Title Company |
|---|---|---|---|
| Dangelo Peter J | $125,000 | -- | |
| Daponte Joaquim | $92,000 | -- | |
| Dime Sb Of Ny Fsb | $114,500 | -- | |
| Paiva Joao M | $185,600 | -- | |
| Sanchez Philip | $134,500 | -- |
Source: Public Records
Mortgage History
| Date | Status | Borrower | Loan Amount |
|---|---|---|---|
| Open | Sanchez Philip | $68,000 | |
| Closed | Sanchez Philip | $25,000 | |
| Closed | Sanchez Philip | $90,000 |
Source: Public Records
Tax History
| Year | Tax Paid | Tax Assessment Tax Assessment Total Assessment is a certain percentage of the fair market value that is determined by local assessors to be the total taxable value of land and additions on the property. | Land | Improvement |
|---|---|---|---|---|
| 2025 | $5,443 | $475,400 | $105,800 | $369,600 |
| 2024 | $5,210 | $453,400 | $101,900 | $351,500 |
| 2023 | $4,564 | $372,000 | $84,200 | $287,800 |
| 2022 | $4,056 | $321,400 | $80,200 | $241,200 |
| 2021 | $3,834 | $277,200 | $76,300 | $200,900 |
| 2020 | $3,449 | $238,700 | $75,200 | $163,500 |
| 2019 | $2,947 | $202,100 | $72,400 | $129,700 |
| 2018 | $2,914 | $199,300 | $78,400 | $120,900 |
| 2017 | $2,740 | $195,700 | $74,800 | $120,900 |
| 2016 | $2,691 | $197,400 | $79,600 | $117,800 |
| 2015 | $2,522 | $192,800 | $79,600 | $113,200 |
| 2014 | $2,534 | $201,400 | $77,200 | $124,200 |
Source: Public Records
Map
Nearby Homes
- 1273-1279 S Main St
- 1334 S Main St
- 70 Brown St
- 71 Mystic St Unit 3
- 82 Montaup St
- 20 Wilcox St
- 219 Montaup St
- 344-354 E Main St
- 240 Montaup St
- 355 Peckham St
- 150 Forest St
- 420 Bradford Ave
- 917 Dwelly St
- 303 Eagle St Unit C
- 111 Park St
- 105 Park St
- 234 Kilburn St
- 334 Fountain St
- 403 Division St Unit 13
- 403 Division St Unit 5
Your Personal Tour Guide
Ask me questions while you tour the home.