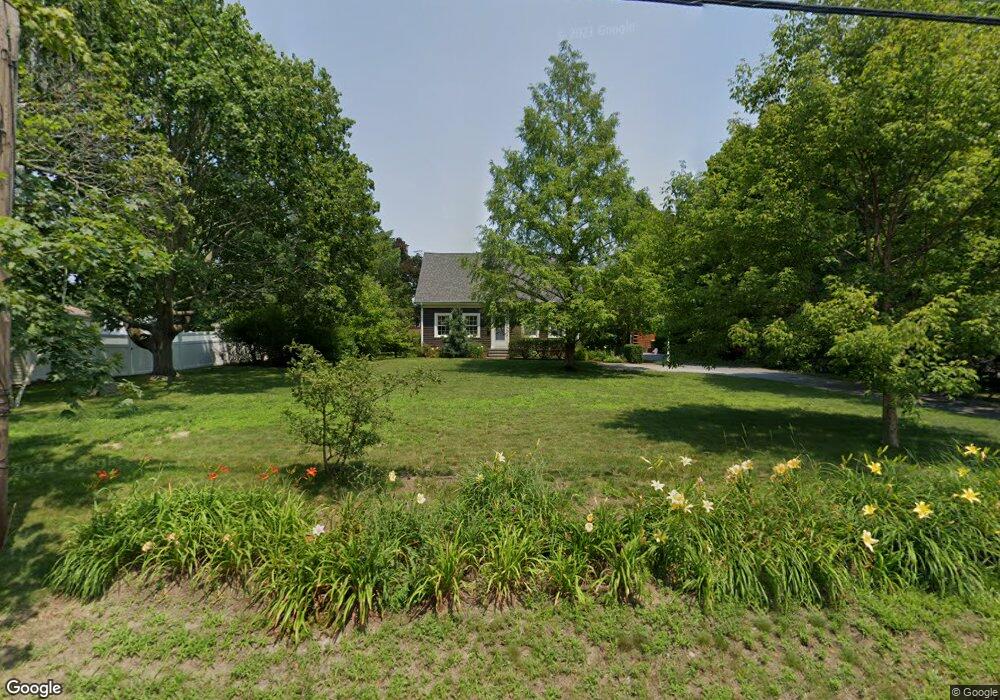
794 Buffinton St Somerset, MA 02726
Pottersville NeighborhoodEstimated Value: $467,000 - $545,000
3
Beds
1
Bath
1,617
Sq Ft
$315/Sq Ft
Est. Value
About This Home
This home is located at 794 Buffinton St, Somerset, MA 02726 and is currently estimated at $508,882, approximately $314 per square foot. 794 Buffinton St is a home located in Bristol County with nearby schools including Chace Street School, Somerset Middle School, and Swansea Wood School.
Ownership History
Date
Name
Owned For
Owner Type
Purchase Details
Closed on
May 20, 1999
Sold by
Bergeron Stephen D and Bergeron Kathleen M
Bought by
Perry Frederick S and Perry Kelly M
Current Estimated Value
Create a Home Valuation Report for This Property
The Home Valuation Report is an in-depth analysis detailing your home's value as well as a comparison with similar homes in the area
Home Values in the Area
Average Home Value in this Area
Purchase History
| Date | Buyer | Sale Price | Title Company |
|---|---|---|---|
| Perry Frederick S | $139,000 | -- | |
| Perry Frederick S | $139,000 | -- |
Source: Public Records
Mortgage History
| Date | Status | Borrower | Loan Amount |
|---|---|---|---|
| Open | Perry Frederick S | $124,000 | |
| Closed | Perry Frederick S | $144,000 | |
| Closed | Perry Frederick S | $123,500 |
Source: Public Records
Tax History Compared to Growth
Tax History
| Year | Tax Paid | Tax Assessment Tax Assessment Total Assessment is a certain percentage of the fair market value that is determined by local assessors to be the total taxable value of land and additions on the property. | Land | Improvement |
|---|---|---|---|---|
| 2025 | $5,869 | $441,300 | $187,200 | $254,100 |
| 2024 | $5,473 | $427,900 | $187,200 | $240,700 |
| 2023 | $4,827 | $380,700 | $162,800 | $217,900 |
| 2022 | $4,468 | $336,200 | $141,400 | $194,800 |
| 2021 | $4,510 | $307,200 | $128,400 | $178,800 |
| 2020 | $4,438 | $291,600 | $129,000 | $162,600 |
| 2019 | $5,061 | $277,300 | $129,000 | $148,300 |
| 2018 | $4,476 | $263,900 | $127,700 | $136,200 |
| 2017 | $4,371 | $251,200 | $121,800 | $129,400 |
| 2016 | $4,399 | $251,200 | $121,800 | $129,400 |
| 2015 | $4,138 | $238,500 | $116,300 | $122,200 |
| 2014 | $5,175 | $214,300 | $113,000 | $101,300 |
Source: Public Records
Map
Nearby Homes
- 34 Barry Ave
- 0 Bark St Unit 73152576
- 0 Bark St Unit 1342599
- 287 Bark St
- 61 Stevens Rd
- 701 Prospect St
- 604 Lafayette St
- 50 Pratt Ave
- 95 Brookside Rd
- 2714 Riverside Ave
- 64 Midland Rd
- 135 Grove Ave
- 265 Stevens Rd
- 64 Jaffrey St
- 224 Chace St
- 126 Jaffrey St
- 4 Swansom Rd
- 82 Perry Ave
- 34 Doherty Ave
- 190 Gibbs St