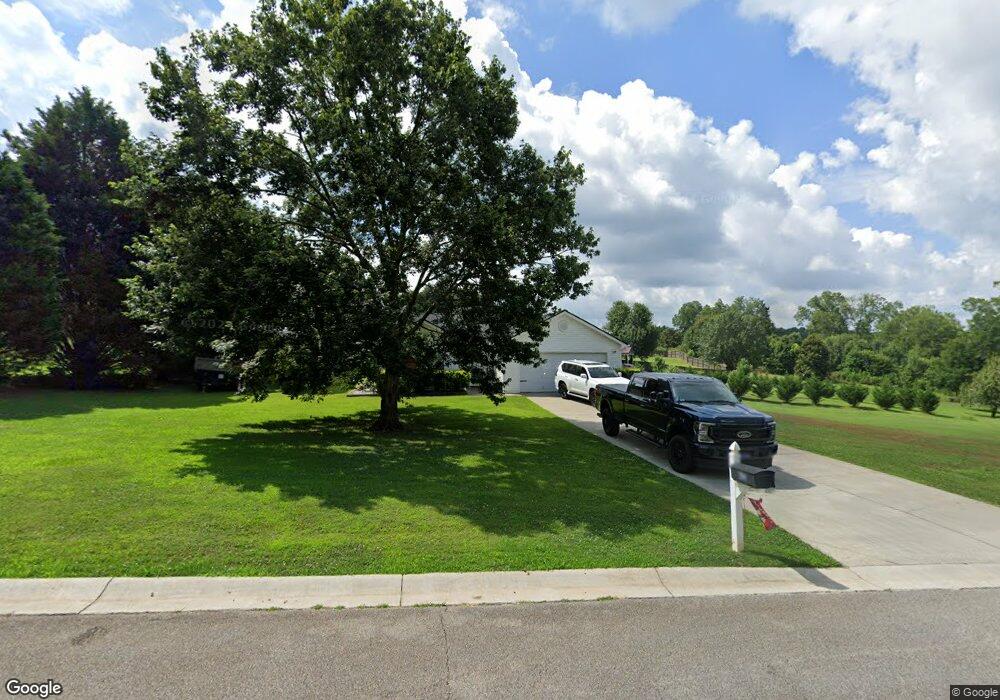
794 Gable Ct Winder, GA 30680
Estimated Value: $289,726 - $311,000
--
Bed
2
Baths
1,347
Sq Ft
$225/Sq Ft
Est. Value
About This Home
This home is located at 794 Gable Ct, Winder, GA 30680 and is currently estimated at $302,682, approximately $224 per square foot. 794 Gable Ct is a home located in Barrow County with nearby schools including Bethlehem Elementary School, Haymon-Morris Middle School, and Apalachee High School.
Ownership History
Date
Name
Owned For
Owner Type
Purchase Details
Closed on
Feb 26, 2004
Sold by
Southfork Hms Inc
Bought by
Milligan Christopher A and Milligan Emily
Current Estimated Value
Home Financials for this Owner
Home Financials are based on the most recent Mortgage that was taken out on this home.
Original Mortgage
$113,300
Interest Rate
5.63%
Mortgage Type
VA
Purchase Details
Closed on
Feb 3, 2004
Sold by
Aamco Paving Contractors Inc
Bought by
Georgia Land And Erosion Llc
Home Financials for this Owner
Home Financials are based on the most recent Mortgage that was taken out on this home.
Original Mortgage
$113,300
Interest Rate
5.63%
Mortgage Type
VA
Purchase Details
Closed on
Aug 27, 2003
Sold by
Hightower Billy A
Bought by
Southfork Homes Inc
Purchase Details
Closed on
Nov 15, 2002
Bought by
Hightower Billy A
Create a Home Valuation Report for This Property
The Home Valuation Report is an in-depth analysis detailing your home's value as well as a comparison with similar homes in the area
Home Values in the Area
Average Home Value in this Area
Purchase History
| Date | Buyer | Sale Price | Title Company |
|---|---|---|---|
| Milligan Christopher A | $115,200 | -- | |
| Georgia Land And Erosion Llc | -- | -- | |
| Georgia Land And Erosion Llc | -- | -- | |
| Southfork Homes Inc | $512,000 | -- | |
| Hightower Billy A | -- | -- |
Source: Public Records
Mortgage History
| Date | Status | Borrower | Loan Amount |
|---|---|---|---|
| Previous Owner | Milligan Christopher A | $113,300 |
Source: Public Records
Tax History Compared to Growth
Tax History
| Year | Tax Paid | Tax Assessment Tax Assessment Total Assessment is a certain percentage of the fair market value that is determined by local assessors to be the total taxable value of land and additions on the property. | Land | Improvement |
|---|---|---|---|---|
| 2024 | $1,856 | $74,089 | $16,000 | $58,089 |
| 2023 | $1,429 | $74,489 | $16,000 | $58,489 |
| 2022 | $1,498 | $51,845 | $16,000 | $35,845 |
| 2021 | $1,569 | $51,845 | $16,000 | $35,845 |
| 2020 | $1,570 | $51,845 | $16,000 | $35,845 |
| 2019 | $1,595 | $51,845 | $16,000 | $35,845 |
| 2018 | $1,341 | $44,957 | $10,800 | $34,157 |
| 2017 | $1,117 | $38,374 | $10,800 | $27,574 |
| 2016 | $1,121 | $38,683 | $10,800 | $27,883 |
| 2015 | $1,135 | $38,992 | $10,800 | $28,192 |
| 2014 | $1,008 | $34,675 | $6,174 | $28,501 |
| 2013 | -- | $33,282 | $6,174 | $27,108 |
Source: Public Records
Map
Nearby Homes
- 0 Gable Ct Unit 8513101
- 0 Gable Ct Unit 8223505
- 0 Gable Ct Unit 3148117
- 0 Gable Ct Unit 3281616
- 0 Gable Ct Unit 7268281
- 788 Gable Ct
- 796 Gable Ct
- 784 Gable Ct
- 784 Gable Ct Unit 1
- 795 Gable Ct
- 795 Gable Ct Unit 1
- 795 Gable Ct Unit 8
- 793 Gable Ct
- 782 Gable Ct
- 797 Gable Ct
- 791 Gable Ct
- 798 Gable Ct
- 789 Gable Ct
- 783 Gable Ct
- 755 Remington Cir Unit 5