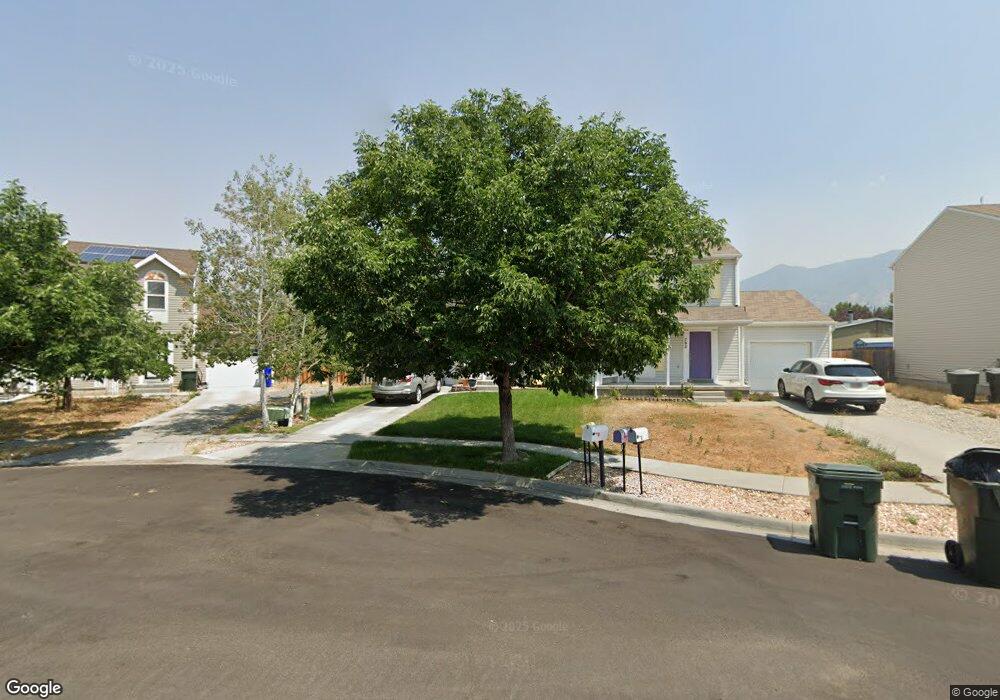
794 N 170 W Tooele, UT 84074
Estimated Value: $320,000 - $345,942
--
Bed
--
Bath
1,820
Sq Ft
$183/Sq Ft
Est. Value
About This Home
This home is located at 794 N 170 W, Tooele, UT 84074 and is currently estimated at $333,486, approximately $183 per square foot. 794 N 170 W is a home located in Tooele County with nearby schools including Northlake Elementary School, Tooele Junior High School, and Tooele High School.
Ownership History
Date
Name
Owned For
Owner Type
Purchase Details
Closed on
Apr 12, 2018
Sold by
Felgh Phillip J and Feigh Jack W
Bought by
Feigh Phillip J
Current Estimated Value
Home Financials for this Owner
Home Financials are based on the most recent Mortgage that was taken out on this home.
Original Mortgage
$138,400
Outstanding Balance
$118,994
Interest Rate
4.43%
Mortgage Type
New Conventional
Estimated Equity
$214,492
Purchase Details
Closed on
Sep 15, 2005
Sold by
Walther Kenton D and Walther Deborah A
Bought by
Feigh Phillip J and Feigh Jack W
Home Financials for this Owner
Home Financials are based on the most recent Mortgage that was taken out on this home.
Original Mortgage
$95,150
Interest Rate
5.76%
Mortgage Type
FHA
Purchase Details
Closed on
Sep 14, 2005
Sold by
Walther Kenton D and Walther Deborah A
Bought by
Feigh Phillip J and Feigh Jack W
Home Financials for this Owner
Home Financials are based on the most recent Mortgage that was taken out on this home.
Original Mortgage
$95,150
Interest Rate
5.76%
Mortgage Type
FHA
Create a Home Valuation Report for This Property
The Home Valuation Report is an in-depth analysis detailing your home's value as well as a comparison with similar homes in the area
Home Values in the Area
Average Home Value in this Area
Purchase History
| Date | Buyer | Sale Price | Title Company |
|---|---|---|---|
| Feigh Phillip J | -- | Novation Title Insurance Age | |
| Feigh Phillip J | -- | First American Title | |
| Feigh Phillip J | -- | First American Title Ins Inc |
Source: Public Records
Mortgage History
| Date | Status | Borrower | Loan Amount |
|---|---|---|---|
| Open | Feigh Phillip J | $138,400 | |
| Previous Owner | Feigh Phillip J | $95,150 |
Source: Public Records
Tax History Compared to Growth
Tax History
| Year | Tax Paid | Tax Assessment Tax Assessment Total Assessment is a certain percentage of the fair market value that is determined by local assessors to be the total taxable value of land and additions on the property. | Land | Improvement |
|---|---|---|---|---|
| 2025 | $2,105 | $175,551 | $50,188 | $125,363 |
| 2024 | $2,369 | $180,855 | $50,188 | $130,667 |
| 2023 | $2,369 | $179,189 | $47,810 | $131,379 |
| 2022 | $2,293 | $197,240 | $62,453 | $134,787 |
| 2021 | $1,378 | $99,156 | $18,597 | $80,559 |
| 2020 | $1,319 | $164,591 | $33,813 | $130,778 |
| 2019 | $1,340 | $164,591 | $33,813 | $130,778 |
| 2018 | $1,210 | $140,829 | $30,000 | $110,829 |
| 2017 | $1,019 | $140,829 | $30,000 | $110,829 |
| 2016 | $719 | $58,686 | $13,750 | $44,936 |
| 2015 | $719 | $52,296 | $0 | $0 |
| 2014 | -- | $52,296 | $0 | $0 |
Source: Public Records
Map
Nearby Homes
- 834 N 200 W
- 705 N 200 E
- 272 W Quartz Rd
- 244 W 670 N
- 312 W Sapphire Dr
- 530 N 50 W
- 232 W 970 N
- 277 W 670 N
- 107 W 600 N Unit 204
- 718 N 410 W
- 683 Hidden River Trail W
- 353 W 630 N Unit 19
- 374 W 630 North St Unit 10
- 435 W Sapphire Dr Unit 7037
- 432 W Sapphire Dr Unit 7012
- 363 W 630 North St Unit 20
- 394 W 630 N Unit 8
- 524 N 200 W
- 451 W Sapphire Dr Unit 7035
- 377 W 630 St N Unit 22