794 S 17th St Columbus, OH 43206
Southern Orchards NeighborhoodEstimated Value: $38,725 - $491,000
3
Beds
1
Bath
1,189
Sq Ft
$132/Sq Ft
Est. Value
About This Home
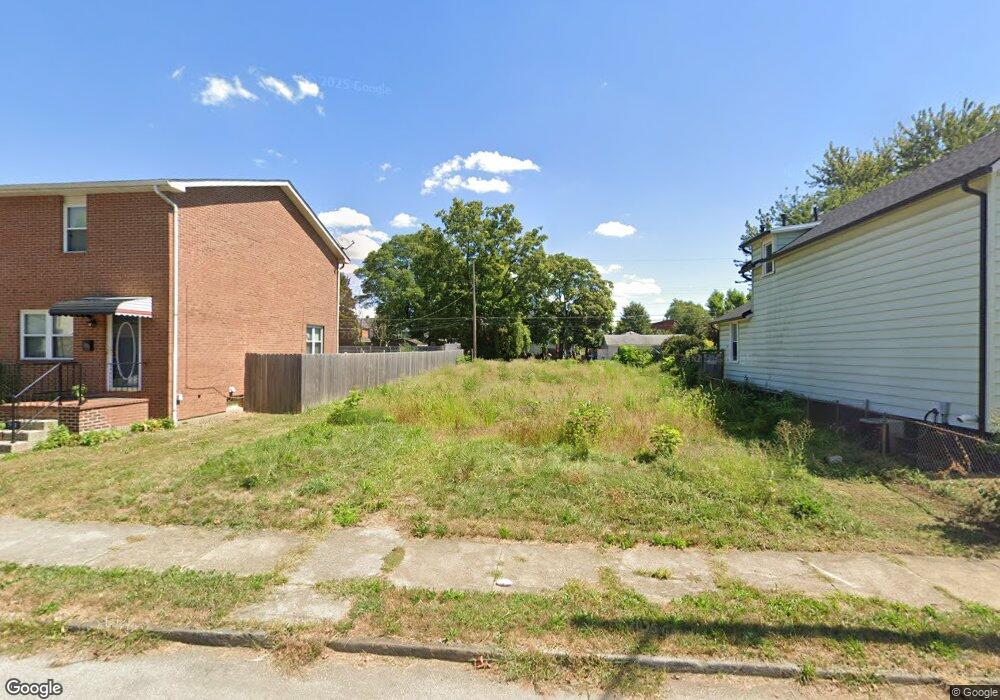
This home is located at 794 S 17th St, Columbus, OH 43206 and is currently estimated at $157,431, approximately $132 per square foot. 794 S 17th St is a home located in Franklin County with nearby schools including Livingston Elementary School, South High School, and South Columbus Preparatory Academy.
Ownership History
Date
Name
Owned For
Owner Type
Purchase Details
Closed on
Jan 13, 2006
Sold by
Butcher Tonya A
Bought by
Butcher Tonya A and Butcher Henry L
Current Estimated Value
Home Financials for this Owner
Home Financials are based on the most recent Mortgage that was taken out on this home.
Original Mortgage
$87,000
Outstanding Balance
$50,444
Interest Rate
6.42%
Mortgage Type
New Conventional
Estimated Equity
$106,987
Purchase Details
Closed on
Jul 30, 2002
Sold by
Butcher Henry L
Bought by
Butcher Tonya A
Home Financials for this Owner
Home Financials are based on the most recent Mortgage that was taken out on this home.
Original Mortgage
$69,700
Interest Rate
6.7%
Purchase Details
Closed on
Aug 13, 1997
Sold by
Butcher Rosetta L and Butcher Rosetta
Bought by
Buthcer Henry L
Create a Home Valuation Report for This Property
The Home Valuation Report is an in-depth analysis detailing your home's value as well as a comparison with similar homes in the area
Home Values in the Area
Average Home Value in this Area
Purchase History
| Date | Buyer | Sale Price | Title Company |
|---|---|---|---|
| Butcher Tonya A | -- | Land Sel Ti | |
| Butcher Tonya A | -- | Landsel Title Agency | |
| Buthcer Henry L | $17,000 | Chicago Title |
Source: Public Records
Mortgage History
| Date | Status | Borrower | Loan Amount |
|---|---|---|---|
| Open | Butcher Tonya A | $87,000 | |
| Closed | Butcher Tonya A | $78,000 | |
| Closed | Butcher Tonya A | $25,000 | |
| Closed | Butcher Tonya A | $25,000 | |
| Closed | Butcher Tonya A | $69,700 | |
| Closed | Butcher Henry L | $61,824 |
Source: Public Records
Tax History Compared to Growth
Tax History
| Year | Tax Paid | Tax Assessment Tax Assessment Total Assessment is a certain percentage of the fair market value that is determined by local assessors to be the total taxable value of land and additions on the property. | Land | Improvement |
|---|---|---|---|---|
| 2024 | $3,213 | $30,940 | $30,940 | -- |
| 2023 | $1,719 | $30,940 | $30,940 | $0 |
| 2022 | $1,927 | $34,970 | $7,070 | $27,900 |
| 2021 | $1,817 | $34,970 | $7,070 | $27,900 |
| 2020 | $1,819 | $34,970 | $7,070 | $27,900 |
| 2019 | $1,750 | $28,840 | $5,460 | $23,380 |
| 2018 | $1,353 | $28,840 | $5,460 | $23,380 |
| 2017 | $1,403 | $28,840 | $5,460 | $23,380 |
| 2016 | $1,058 | $15,970 | $3,960 | $12,010 |
| 2015 | $960 | $15,970 | $3,960 | $12,010 |
| 2014 | $963 | $15,970 | $3,960 | $12,010 |
| 2013 | $460 | $15,470 | $4,165 | $11,305 |
Source: Public Records
Map
Nearby Homes
- 792 S 18th St
- 786 Ann St
- 667 E Columbus St
- 841 Ann St
- 1095 E Sycamore St
- 863 Carpenter St
- 901 Heyl Ave
- 800 Carpenter St
- 575 E Columbus St Unit 577
- 785 Gilbert St
- 644 Stanley Ave
- 954 S 18th St
- 958 S 18th St
- 903 E Livingston Ave
- 517 Forest St
- 561 South Ln
- 977 Heyl Ave
- 556 Stanley Ave
- 975 Carpenter St
- 867 S 22nd St
- 800 S 17th St
- 790 S 17th St Unit 792
- 806 S 17th St
- 784 S 17th St
- 778 S 17th St
- 787 S 17th St
- 801 S 18th St Unit 803
- 805 S 17th St
- 789 S 17th St
- 816 S 17th St
- 777 S 17th St
- 791 S 17th St Unit 793
- 772 S 17th St
- 785 S 17th St
- 822 S 17th St Unit 830
- 803 S 17th St Unit 805
- 785 S 18th St
- 781 S 17th St
- 795 S 18th St
- 775-777 S 17th St