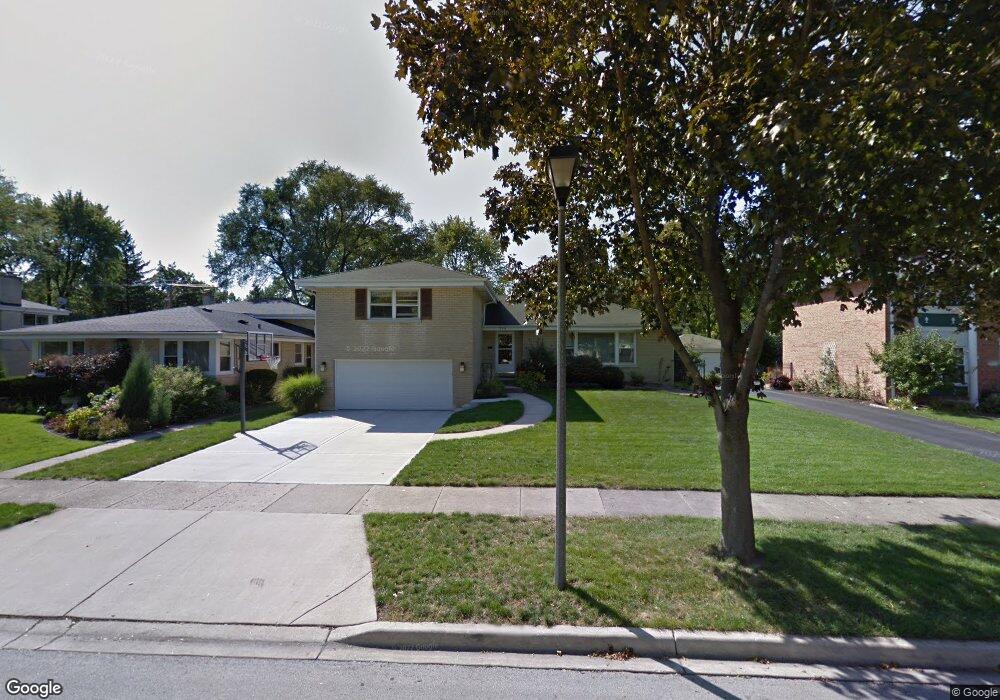
794 S Saylor Ave Elmhurst, IL 60126
Estimated Value: $713,722 - $805,000
3
Beds
3
Baths
2,104
Sq Ft
$364/Sq Ft
Est. Value
About This Home
This home is located at 794 S Saylor Ave, Elmhurst, IL 60126 and is currently estimated at $765,181, approximately $363 per square foot. 794 S Saylor Ave is a home located in DuPage County with nearby schools including Jackson Elementary School, Bryan Middle School, and York Community High School.
Ownership History
Date
Name
Owned For
Owner Type
Purchase Details
Closed on
Apr 13, 2007
Sold by
Srinivasan Sayee and Ramaswamy Sashikala
Bought by
Vallicelli Jacob A and Vallicelli Kelly R
Current Estimated Value
Home Financials for this Owner
Home Financials are based on the most recent Mortgage that was taken out on this home.
Original Mortgage
$370,000
Outstanding Balance
$224,204
Interest Rate
6.19%
Mortgage Type
Purchase Money Mortgage
Estimated Equity
$540,977
Purchase Details
Closed on
Jun 14, 2002
Sold by
Bush Alan V and Bush Lael L
Bought by
Srinivasan Sayees and Ramaswamy Sashilala
Home Financials for this Owner
Home Financials are based on the most recent Mortgage that was taken out on this home.
Original Mortgage
$300,000
Interest Rate
6.87%
Create a Home Valuation Report for This Property
The Home Valuation Report is an in-depth analysis detailing your home's value as well as a comparison with similar homes in the area
Home Values in the Area
Average Home Value in this Area
Purchase History
| Date | Buyer | Sale Price | Title Company |
|---|---|---|---|
| Vallicelli Jacob A | $462,500 | Multiple | |
| Srinivasan Sayees | $380,000 | -- |
Source: Public Records
Mortgage History
| Date | Status | Borrower | Loan Amount |
|---|---|---|---|
| Open | Vallicelli Jacob A | $370,000 | |
| Previous Owner | Srinivasan Sayees | $300,000 |
Source: Public Records
Tax History Compared to Growth
Tax History
| Year | Tax Paid | Tax Assessment Tax Assessment Total Assessment is a certain percentage of the fair market value that is determined by local assessors to be the total taxable value of land and additions on the property. | Land | Improvement |
|---|---|---|---|---|
| 2024 | $11,075 | $191,764 | $103,068 | $88,696 |
| 2023 | $10,280 | $177,330 | $95,310 | $82,020 |
| 2022 | $10,113 | $172,770 | $91,630 | $81,140 |
| 2021 | $9,862 | $168,470 | $89,350 | $79,120 |
| 2020 | $9,481 | $164,780 | $87,390 | $77,390 |
| 2019 | $9,281 | $156,670 | $83,090 | $73,580 |
| 2018 | $10,506 | $175,590 | $78,650 | $96,940 |
| 2017 | $10,279 | $167,330 | $74,950 | $92,380 |
| 2016 | $10,066 | $157,640 | $70,610 | $87,030 |
| 2015 | $9,970 | $146,860 | $65,780 | $81,080 |
| 2014 | $9,094 | $124,010 | $52,210 | $71,800 |
| 2013 | $8,996 | $125,760 | $52,950 | $72,810 |
Source: Public Records
Map
Nearby Homes
- 805 S Spring Rd
- 801 S Spring Rd
- 814 S Saylor Ave
- 816 S Spring Rd
- 762 S Saylor Ave
- 740 S Berkley Ave
- 769 S Fairview Ave
- 722 S Berkley Ave
- 936 S Mitchell Ave
- 963 S Saylor Ave
- 663 S Hawthorne Ave
- 634 S Spring Rd
- 680 S Bryan St
- 618 S Swain Ave
- 991 S Swain Ave
- 995 S Swain Ave
- 611 S Prospect Ave
- 663 S Sunnyside Ave
- 1005 S Mitchell Ave
- 570 S Parkside Ave
- 798 S Saylor Ave
- 790 S Saylor Ave
- 804 S Saylor Ave
- 786 S Saylor Ave
- 791 S Spring Rd
- 795 S Saylor Ave
- 791 S Saylor Ave
- 787 S Spring Rd
- 782 S Saylor Ave
- 781 S Spring Rd
- 810 S Saylor Ave
- 799 S Saylor Ave
- 787 S Saylor Ave
- 777 S Spring Rd
- 803 S Saylor Ave
- 783 S Saylor Ave
- 809 S Spring Rd
- 264 W Madison St
- 813 S Spring Rd
- 281 W Madison St