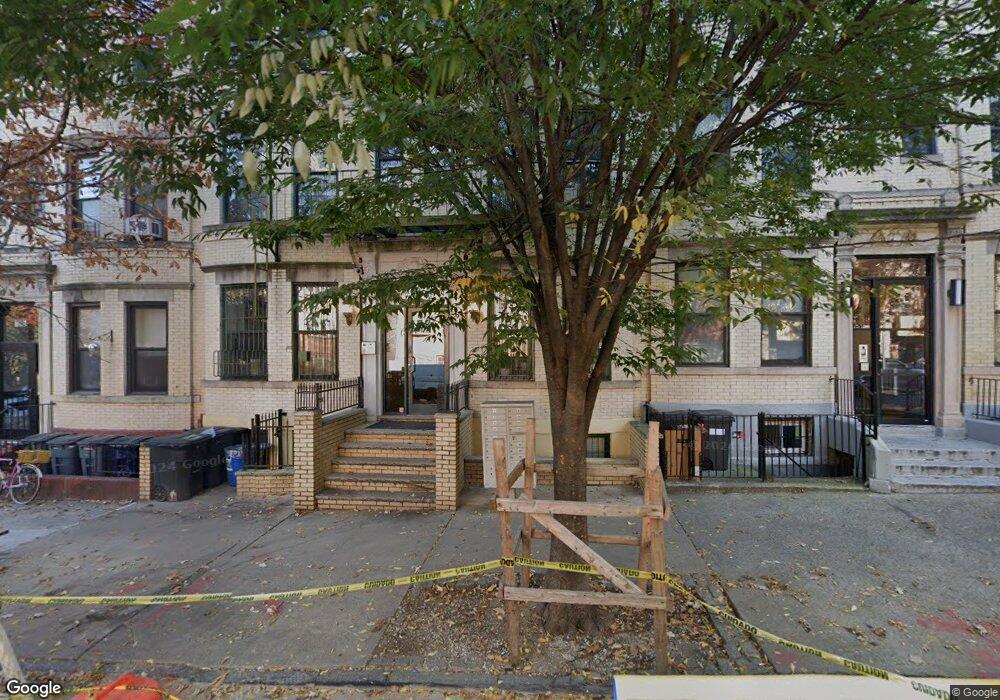
794 St Johns Place Unit 2A Crownhei, NY 11216
Crown Heights NeighborhoodEstimated Value: $514,000 - $792,000
1
Bed
1
Bath
513
Sq Ft
$1,210/Sq Ft
Est. Value
About This Home
This home is located at 794 St Johns Place Unit 2A, Crownhei, NY 11216 and is currently estimated at $620,860, approximately $1,210 per square foot. 794 St Johns Place Unit 2A is a home located in Kings County with nearby schools including P.S. 138, Success Academy Prospect Heights, and New Visions Aim Charter High School I..
Ownership History
Date
Name
Owned For
Owner Type
Purchase Details
Closed on
Dec 5, 2014
Sold by
Taylor Zwehla
Bought by
Amerosa Christine
Current Estimated Value
Home Financials for this Owner
Home Financials are based on the most recent Mortgage that was taken out on this home.
Original Mortgage
$306,000
Outstanding Balance
$235,256
Interest Rate
4.02%
Mortgage Type
New Conventional
Estimated Equity
$385,604
Purchase Details
Closed on
Oct 11, 2007
Sold by
794 St Johns Llc
Bought by
Taylor Zwehla
Home Financials for this Owner
Home Financials are based on the most recent Mortgage that was taken out on this home.
Original Mortgage
$47,200
Interest Rate
6.39%
Create a Home Valuation Report for This Property
The Home Valuation Report is an in-depth analysis detailing your home's value as well as a comparison with similar homes in the area
Home Values in the Area
Average Home Value in this Area
Purchase History
| Date | Buyer | Sale Price | Title Company |
|---|---|---|---|
| Amerosa Christine | $360,000 | -- | |
| Amerosa Christine | $360,000 | -- | |
| Taylor Zwehla | $236,000 | -- | |
| Taylor Zwehla | $236,000 | -- |
Source: Public Records
Mortgage History
| Date | Status | Borrower | Loan Amount |
|---|---|---|---|
| Open | Amerosa Christine | $306,000 | |
| Closed | Amerosa Christine | $306,000 | |
| Previous Owner | Taylor Zwehla | $47,200 | |
| Previous Owner | Taylor Zwehla | $188,800 |
Source: Public Records
Tax History Compared to Growth
Tax History
| Year | Tax Paid | Tax Assessment Tax Assessment Total Assessment is a certain percentage of the fair market value that is determined by local assessors to be the total taxable value of land and additions on the property. | Land | Improvement |
|---|---|---|---|---|
| 2025 | $3,250 | $29,336 | $1,345 | $27,991 |
| 2024 | $3,250 | $25,999 | $1,345 | $24,654 |
| 2023 | $3,471 | $29,388 | $1,345 | $28,043 |
| 2022 | $3,414 | $27,913 | $1,345 | $26,568 |
| 2021 | $3,126 | $25,482 | $1,345 | $24,137 |
| 2020 | $1,566 | $29,052 | $1,345 | $27,707 |
| 2019 | $3,020 | $29,646 | $1,345 | $28,301 |
| 2018 | $2,772 | $27,448 | $1,345 | $26,103 |
| 2017 | $2,466 | $21,497 | $1,345 | $20,152 |
| 2016 | $2,323 | $22,222 | $1,345 | $20,877 |
| 2015 | $1,475 | $18,911 | $1,345 | $17,566 |
| 2014 | $1,475 | $18,885 | $1,345 | $17,540 |
Source: Public Records
Map
Nearby Homes
- 794 St Johns Place Unit 3C
- 469 Eastern Pkwy Unit M
- 465 Eastern Pkwy Unit C
- 465 Eastern Pkwy Unit D
- 744 Park Place Unit 3B
- 744 Park Place Unit 2A
- 744 Park Place Unit 2B
- 744 Park Place Unit 3A
- 744 Park Place Unit 4B
- 744 Park Place Unit 1B
- 1209 Union St
- 848 Park Place Unit 4E
- 86 Rogers Ave
- 84 Rogers Ave
- 718 Sterling Place
- 860 Park Ave Unit 6
- 860 Park Ave Unit 3
- 732 Prospect Place
- 1198 Union St
- 794 St Johns Place Unit 1D
- 794 St Johns Place Unit 1B
- 794 St Johns Place Unit 2B
- 794 St Johns Place Unit 4-D
- 794 St Johns Place Unit 4B
- 794 St Johns Place Unit 4A
- 794 St Johns Place Unit 1C
- 794 St Johns Place Unit 2C
- 794 Saint Johns Place Unit 4D
- 794 Saint Johns Place Unit 4C
- 794 Saint Johns Place Unit 4B
- 794 Saint Johns Place Unit 4A
- 794 Saint Johns Place Unit 3D
- 794 Saint Johns Place Unit 3C
- 794 Saint Johns Place Unit 3B
- 794 Saint Johns Place Unit 3A
- 794 Saint Johns Place Unit 2D
- 794 Saint Johns Place Unit 2C
- 794 Saint Johns Place Unit 2B
- 794 Saint Johns Place Unit 2A