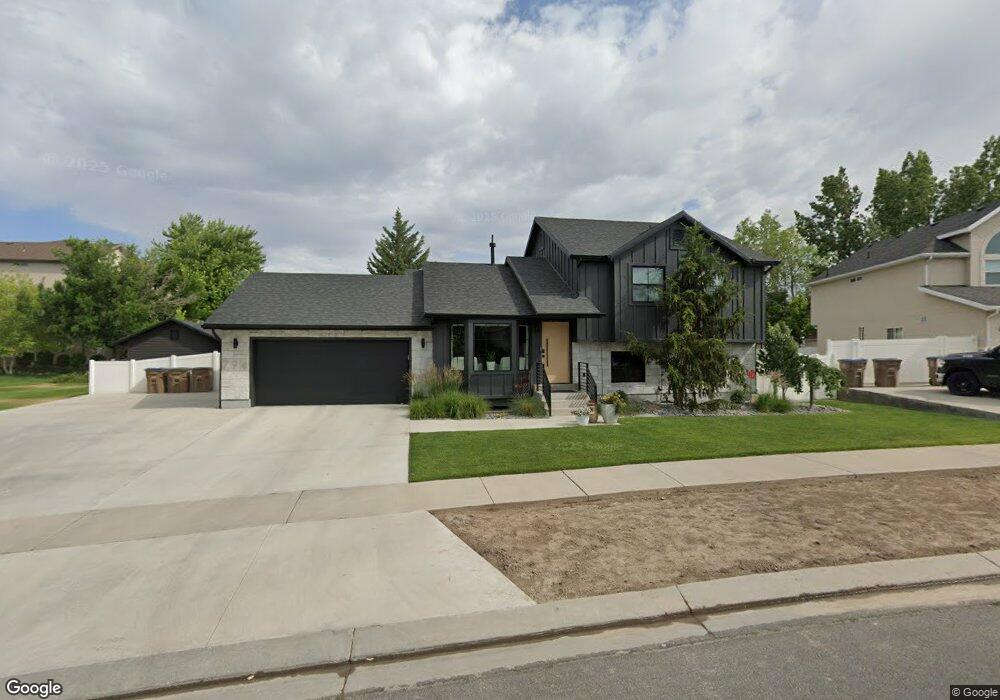
794 Stephens View Way Draper, UT 84020
Estimated Value: $684,000 - $888,000
5
Beds
3
Baths
1,577
Sq Ft
$496/Sq Ft
Est. Value
About This Home
This home is located at 794 Stephens View Way, Draper, UT 84020 and is currently estimated at $782,351, approximately $496 per square foot. 794 Stephens View Way is a home located in Salt Lake County with nearby schools including Crescent School, Mount Jordan Middle School, and American Preparatory Academy - Draper 2 Campus.
Ownership History
Date
Name
Owned For
Owner Type
Purchase Details
Closed on
Mar 29, 2000
Sold by
Rennert Aaron T and Rennert Julie A
Bought by
Hansen Neal A
Current Estimated Value
Home Financials for this Owner
Home Financials are based on the most recent Mortgage that was taken out on this home.
Original Mortgage
$184,203
Outstanding Balance
$63,788
Interest Rate
8.38%
Estimated Equity
$718,563
Purchase Details
Closed on
May 20, 1998
Sold by
Birrell John A and Birrell Jeralyn A
Bought by
Rennert Aaron T and Rennert Julie A
Purchase Details
Closed on
Oct 17, 1996
Sold by
Huish Jerry
Bought by
Castle Homes L L C
Home Financials for this Owner
Home Financials are based on the most recent Mortgage that was taken out on this home.
Original Mortgage
$117,600
Interest Rate
2%
Create a Home Valuation Report for This Property
The Home Valuation Report is an in-depth analysis detailing your home's value as well as a comparison with similar homes in the area
Home Values in the Area
Average Home Value in this Area
Purchase History
| Date | Buyer | Sale Price | Title Company |
|---|---|---|---|
| Hansen Neal A | -- | Associated Title | |
| Rennert Aaron T | -- | Pinnacle Title Ins Agency | |
| Castle Homes L L C | -- | -- | |
| Castle Homes Llc | -- | -- |
Source: Public Records
Mortgage History
| Date | Status | Borrower | Loan Amount |
|---|---|---|---|
| Open | Hansen Neal A | $184,203 | |
| Previous Owner | Castle Homes L L C | $117,600 |
Source: Public Records
Tax History
| Year | Tax Paid | Tax Assessment Tax Assessment Total Assessment is a certain percentage of the fair market value that is determined by local assessors to be the total taxable value of land and additions on the property. | Land | Improvement |
|---|---|---|---|---|
| 2025 | $3,752 | $780,100 | $236,600 | $543,500 |
| 2024 | $3,752 | $716,700 | $224,500 | $492,200 |
| 2023 | $3,725 | $706,300 | $220,100 | $486,200 |
| 2022 | $3,583 | $656,200 | $215,800 | $440,400 |
| 2021 | $3,059 | $478,600 | $153,200 | $325,400 |
| 2020 | $2,712 | $402,200 | $153,200 | $249,000 |
| 2019 | $2,684 | $388,900 | $141,500 | $247,400 |
| 2016 | $2,388 | $329,300 | $141,500 | $187,800 |
Source: Public Records
Map
Nearby Homes
- 802 W Stephens View Way
- 552 Sunset Crest Way
- 12235 S Ryder Ct
- 722 W Webb Rd
- 11979 Draper Ridge Dr
- 11872 S Ridge Oak Ln
- 12091 S Lampton View Dr
- 401 W Election Rd
- 11781 S Halls Creek Rd
- 12021 Misty Sea Rd
- 11749 S Halls Creek Rd
- 11708 S Engelmann Dr
- 11737 S Halls Creek Rd
- 11718 S Halls Creek Rd
- 11618 S Douglas Vista Dr
- 12252 Margaret Rose Dr
- 11711 S Halls Creek Rd
- 11673 S Halls Creek Rd
- 11617 S Wildrye Field Way
- 11566 S Junegrass Dr
- 794 W Stephens View Way
- 782 W Stephens View Way
- 782 Stephens View Way
- 802 Stephens View Way
- 802 W Stephens View Way Unit 110
- 12167 S Samson Cir
- 12167 Samson Cir
- 12193 Jerema Ct
- 12161 S Samson Cir
- 12161 Samson Cir
- 772 W Stephens View Way
- 772 Stephens View Way
- 797 Stephens View Way
- 797 W Stephens View Way Unit 109
- 12168 Andrew View Cir
- 12164 Samson Cir
- 783 Stephens View Way
- 783 W Stephens View Way
- 12219 S Jerema Ct
- 12219 Jerema Ct
Your Personal Tour Guide
Ask me questions while you tour the home.