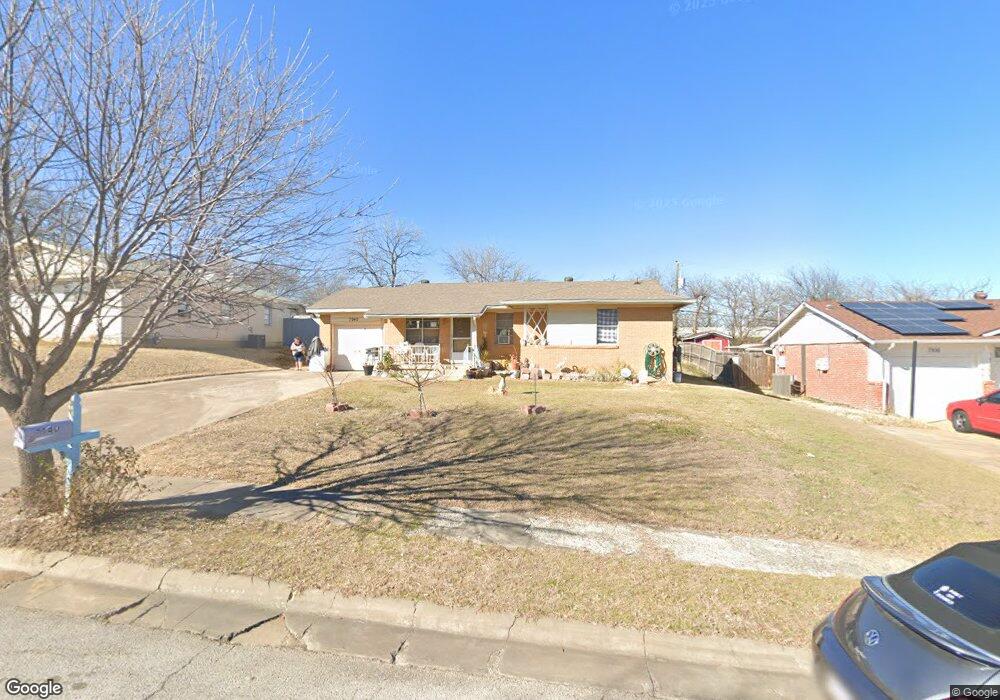
7940 Chaparral Dr Fort Worth, TX 76108
Estimated Value: $196,000 - $225,000
3
Beds
1
Bath
1,142
Sq Ft
$183/Sq Ft
Est. Value
About This Home
This home is located at 7940 Chaparral Dr, Fort Worth, TX 76108 and is currently estimated at $208,622, approximately $182 per square foot. 7940 Chaparral Dr is a home located in Tarrant County with nearby schools including Liberty Elementary School, Brewer Middle School, and Tannahill Intermediate School.
Ownership History
Date
Name
Owned For
Owner Type
Purchase Details
Closed on
Nov 22, 2005
Sold by
Alvarado Jorge A and Alvarado Flor I
Bought by
Loera Jose
Current Estimated Value
Home Financials for this Owner
Home Financials are based on the most recent Mortgage that was taken out on this home.
Original Mortgage
$78,200
Outstanding Balance
$42,847
Interest Rate
6.04%
Mortgage Type
Fannie Mae Freddie Mac
Estimated Equity
$165,775
Purchase Details
Closed on
Nov 21, 2003
Sold by
Alvarado Epigmenio and Alvarado Cipriana
Bought by
Alvarado Jorge A and Alvarado Flor I
Purchase Details
Closed on
Nov 23, 1998
Sold by
Ofarrell Mary Ann and Parish Mary A
Bought by
Alvarado Jorge A and Alvarado Flor I
Home Financials for this Owner
Home Financials are based on the most recent Mortgage that was taken out on this home.
Original Mortgage
$29,000
Interest Rate
6.69%
Purchase Details
Closed on
Jan 2, 1998
Sold by
Parish Raymond C
Bought by
Parish Mary A
Create a Home Valuation Report for This Property
The Home Valuation Report is an in-depth analysis detailing your home's value as well as a comparison with similar homes in the area
Home Values in the Area
Average Home Value in this Area
Purchase History
| Date | Buyer | Sale Price | Title Company |
|---|---|---|---|
| Loera Jose | -- | North American Title Co | |
| Alvarado Jorge A | -- | Commonwealth Land Title | |
| Alvarado Jorge A | -- | Commonwealth Land Title | |
| Parish Mary A | -- | -- |
Source: Public Records
Mortgage History
| Date | Status | Borrower | Loan Amount |
|---|---|---|---|
| Open | Loera Jose | $78,200 | |
| Previous Owner | Alvarado Jorge A | $29,000 |
Source: Public Records
Tax History Compared to Growth
Tax History
| Year | Tax Paid | Tax Assessment Tax Assessment Total Assessment is a certain percentage of the fair market value that is determined by local assessors to be the total taxable value of land and additions on the property. | Land | Improvement |
|---|---|---|---|---|
| 2025 | $633 | $214,833 | $45,455 | $169,378 |
| 2024 | $633 | $214,833 | $45,455 | $169,378 |
| 2023 | $2,818 | $208,107 | $45,455 | $162,652 |
| 2022 | $2,918 | $156,880 | $25,000 | $131,880 |
| 2021 | $2,695 | $140,742 | $25,000 | $115,742 |
| 2020 | $2,468 | $122,022 | $25,000 | $97,022 |
| 2019 | $2,329 | $115,623 | $25,000 | $90,623 |
| 2018 | $422 | $73,604 | $12,000 | $61,604 |
| 2017 | $1,955 | $100,784 | $12,000 | $88,784 |
| 2016 | $1,778 | $95,231 | $12,000 | $83,231 |
| 2015 | $243 | $55,300 | $9,000 | $46,300 |
| 2014 | $243 | $55,300 | $9,000 | $46,300 |
Source: Public Records
Map
Nearby Homes
- 8000 Chaparral Dr
- 7936 Chaparral Dr
- 7941 Tumbleweed Trail
- 7937 Tumbleweed Trail
- 8001 Tumbleweed Trail
- 8004 Chaparral Dr
- 7932 Chaparral Dr
- 7941 Chaparral Dr
- 8005 Tumbleweed Trail
- 7933 Tumbleweed Trail
- 8001 Chaparral Dr
- 7937 Chaparral Dr
- 8008 Chaparral Dr
- 7928 Chaparral Dr
- 7933 Chaparral Dr
- 8005 Chaparral Dr
- 8009 Tumbleweed Trail
- 7929 Tumbleweed Trail
- 8012 Chaparral Dr
- 7929 Chaparral Dr