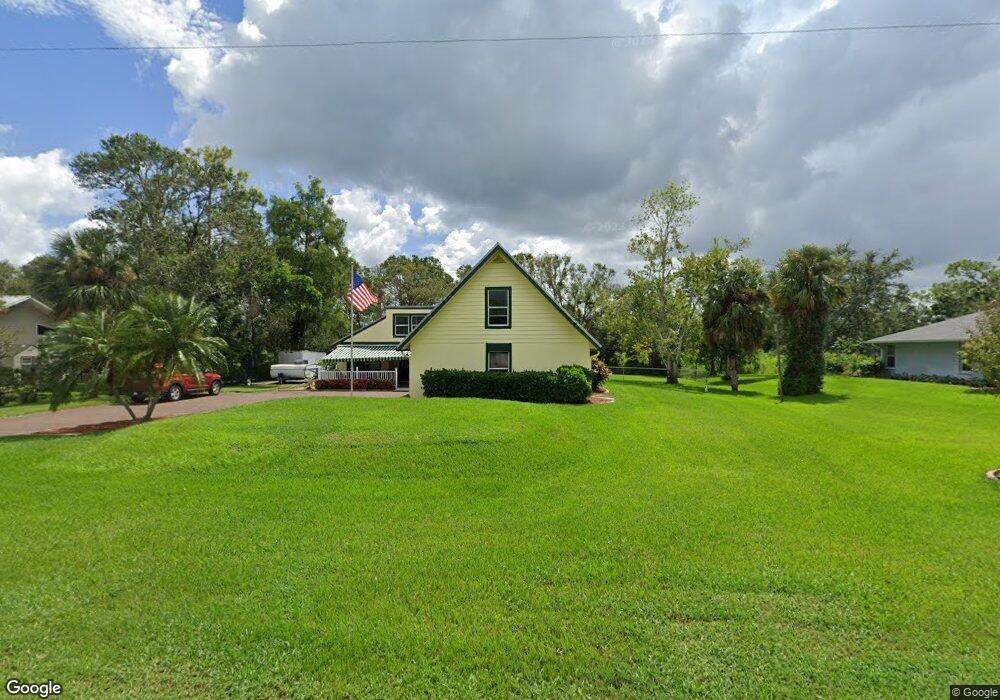
7941 Deni Dr North Fort Myers, FL 33917
Estimated Value: $462,000 - $594,000
3
Beds
2
Baths
2,792
Sq Ft
$186/Sq Ft
Est. Value
About This Home
This home is located at 7941 Deni Dr, North Fort Myers, FL 33917 and is currently estimated at $519,476, approximately $186 per square foot. 7941 Deni Dr is a home located in Lee County with nearby schools including Bayshore Elementary School, Orange River Elementary School, and Tice Elementary School.
Ownership History
Date
Name
Owned For
Owner Type
Purchase Details
Closed on
Feb 22, 2005
Sold by
Altman Scott D and Altman Pamela C
Bought by
Drabik David L and Drabik Sandra D
Current Estimated Value
Home Financials for this Owner
Home Financials are based on the most recent Mortgage that was taken out on this home.
Original Mortgage
$157,850
Outstanding Balance
$79,493
Interest Rate
5.61%
Mortgage Type
Stand Alone First
Estimated Equity
$439,983
Purchase Details
Closed on
Mar 13, 2002
Sold by
Johnson Dewey A and Johnson Abby
Bought by
Altman Scott D and Altman Pamela C
Home Financials for this Owner
Home Financials are based on the most recent Mortgage that was taken out on this home.
Original Mortgage
$119,200
Interest Rate
6.98%
Purchase Details
Closed on
Jan 28, 2000
Sold by
Clark Daniel W and Clark Kathleen R
Bought by
Johnson Dewey A and Johnson Abby J
Home Financials for this Owner
Home Financials are based on the most recent Mortgage that was taken out on this home.
Original Mortgage
$130,050
Interest Rate
7.9%
Create a Home Valuation Report for This Property
The Home Valuation Report is an in-depth analysis detailing your home's value as well as a comparison with similar homes in the area
Home Values in the Area
Average Home Value in this Area
Purchase History
| Date | Buyer | Sale Price | Title Company |
|---|---|---|---|
| Drabik David L | $225,500 | Accent Title Ins Agency Inc | |
| Altman Scott D | $164,000 | -- | |
| Johnson Dewey A | $144,500 | -- |
Source: Public Records
Mortgage History
| Date | Status | Borrower | Loan Amount |
|---|---|---|---|
| Open | Drabik David L | $157,850 | |
| Previous Owner | Altman Scott D | $144,000 | |
| Previous Owner | Altman Scott D | $119,200 | |
| Previous Owner | Johnson Dewey A | $130,050 |
Source: Public Records
Tax History Compared to Growth
Tax History
| Year | Tax Paid | Tax Assessment Tax Assessment Total Assessment is a certain percentage of the fair market value that is determined by local assessors to be the total taxable value of land and additions on the property. | Land | Improvement |
|---|---|---|---|---|
| 2025 | $2,570 | $192,499 | -- | -- |
| 2024 | $2,489 | $187,074 | -- | -- |
| 2023 | $2,489 | $181,625 | $0 | $0 |
| 2022 | $2,604 | $176,335 | $0 | $0 |
| 2021 | $2,520 | $237,340 | $48,827 | $188,513 |
| 2020 | $2,524 | $168,835 | $0 | $0 |
| 2019 | $2,485 | $165,039 | $0 | $0 |
| 2018 | $2,476 | $161,962 | $0 | $0 |
| 2017 | $2,468 | $158,631 | $0 | $0 |
| 2016 | $2,284 | $193,991 | $19,521 | $174,470 |
| 2015 | $2,303 | $177,810 | $19,374 | $158,436 |
| 2014 | -- | $168,503 | $18,054 | $150,449 |
| 2013 | -- | $162,996 | $17,389 | $145,607 |
Source: Public Records
Map
Nearby Homes
- 16880 Church Dr
- 7831 Deni Dr
- 16890 Church Dr
- 59 Jim Bowie St
- 61 Sam Houston Dr
- 7821 Deni Dr
- 66 Sam Houston Dr
- 17200 S Pioneer St Unit G-13
- 17200 S Pioneer St Unit E4-10
- 17200 S Pioneer St Unit RV-66
- 38 S Pioneer St
- 7974 Samville Rd Unit E5-24
- 16571 Marc Allen Dr
- 32 S Pioneer St
- 8411 Wagon Wheel Cir
- 1753 Club House Rd
- 7970 Samville Rd
- 8363 Wagon Wheel Cir
- 8251 Wagon Wheel Cir Unit 6
- 2475 Bridge Rd